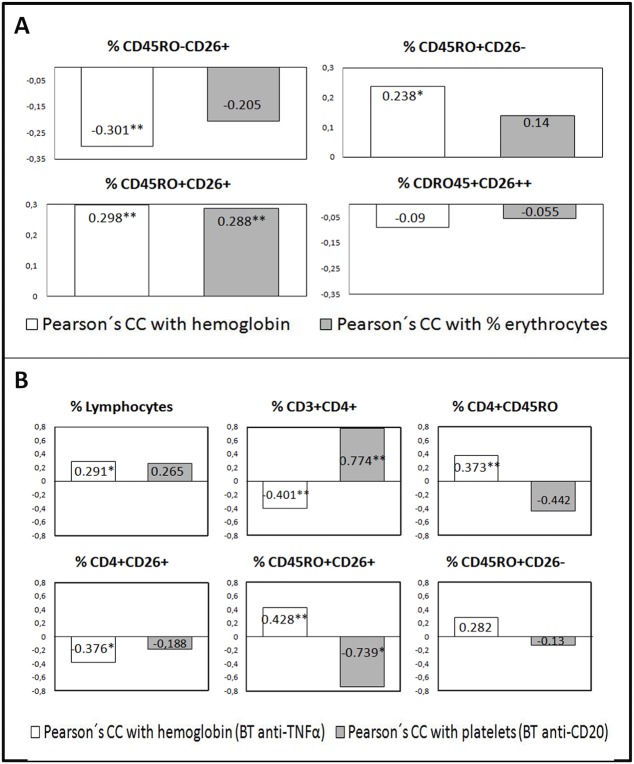
Fig 4. Correlations of CD4+ T cell subsets defined by surface CD45R0 and CD26 expression with non-DAS28 RA activity variables hemoglobin (Hb), hematocrit and the platelet count.
A) In the whole cohort of patients a low positive correlations seen between the percentages of CD45R0+CD26+ and CD45R0+CD26- subsets with Hb (white bars) (numbers represent Pearson’s coefficient, r, asterisks for statistical significance, *p<0.05, ** p<0.005) or % erythrocytes (dark bars), whereas the CD45R0-CD26+ subset showed a negative correlation and the CD26high subset did not correlate. B) Correlations of the four cell subsets in two patients’ groups. In the anti-TNF group some statistically significant correlations with Hb are shown for some T cell subsets (white bars). In the anti-CD20 group those cell populations show correlations with the platelet count (dark bars), generally in the opposite direction compared to the anti-TNF group. Non-significant correlations in the panels are shown only when the total cell number of the subset (instead of the percentage) was significant.

