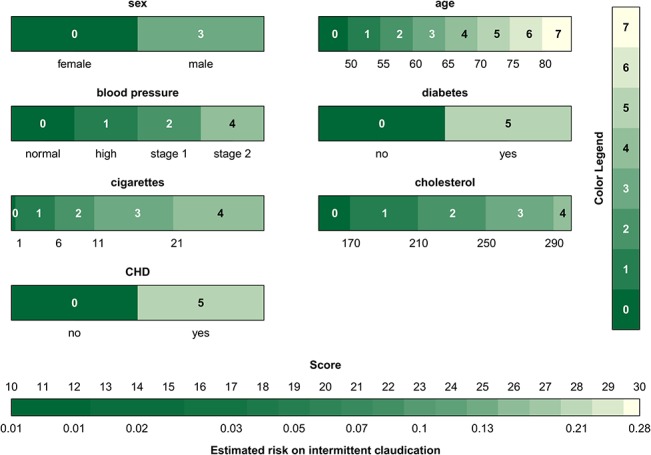
Fig 2. Graphical representation of the intermittent claudication score system.

The colors relate to the points that are attributed to a predictor value. Dark green indicates a low contribution and light green to ecru a high contribution to the risk. The points corresponding to the colors are indicated within each interval and by means of the color legend. It is instantly seen that older age and having diabetes or coronary heart disease have the highest contribution to the risk of intermittent claudication. Addition of all points corresponding to the predictor values of a patient gives the score which can then be converted into a risk estimate by means of the color bar at the bottom.
