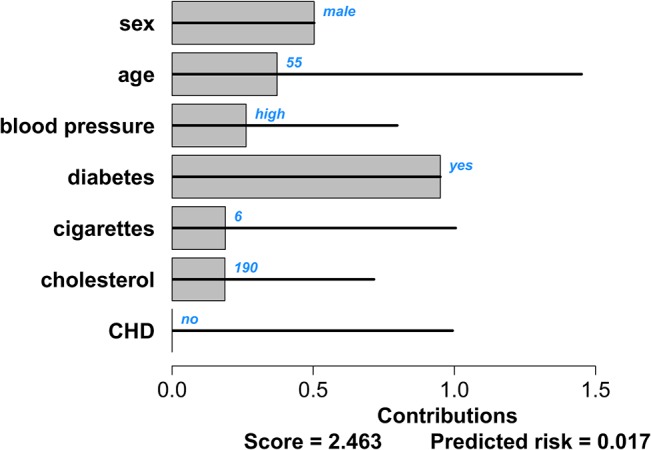
Fig 4. Contribution chart for the intermittent claudication model for a patient with a good prognosis: a 55 year old man with a high blood pressure and diabetes, who smokes 6 cigarettes a day and has a cholesterol value of 190 mg/dL.

The black lines indicate the range of contributions for each predictor as observed in the data set. The bars indicate the predictors’ contributions to the linear predictor for this specific patient. The patient-specific predictor values are indicated in blue. The score at the bottom of the graph is the sum of all predictor contributions. The estimated risk of intermittent claudication corresponding to this score is given as well.
