
Fig 3. Pluripotency analyses of fused cells.
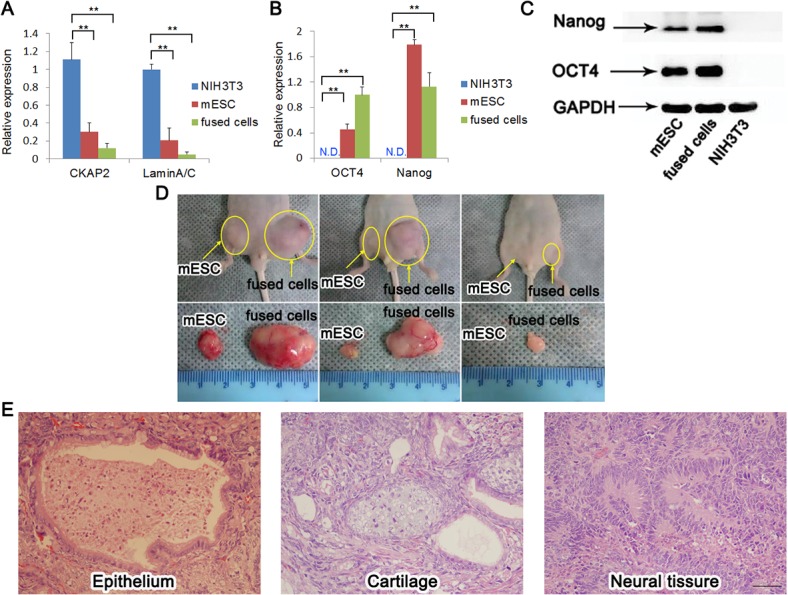
(A) RT-qPCR analysis of the gene expression of somatic cell markers (mean + s.d.; **P<0.01, n = 3). GAPDH was used as an internal control. (B) RT-qPCR analysis of the gene expression of stem cell markers (mean + s.d.; **P<0.01; N.D. indicated no data, n = 3). GAPDH was used as an internal control. (C) Western blotting analysis of the level of Nanog and OCT4. GAPDH was used as a loading control. (D) Teratomas formation in the nude mice. mESCs were used as a control. (E) Histology of teratomas that were derived from fused cells. Left, epithelium (endoderm); middle, cartilage (mesoderm); right, neural tissue (ectoderm). Scale bar, 50 μm.