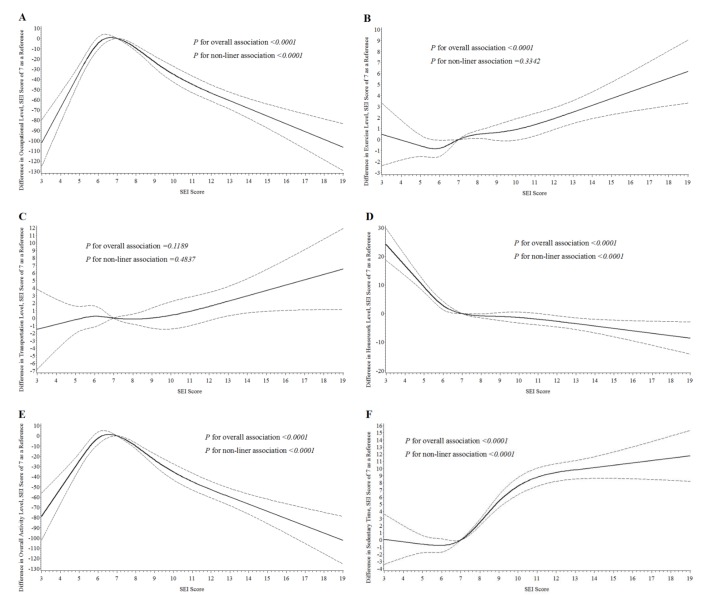
Fig 1. Associations of SEI score with overall and different types of PA level, the community-based survey in Jiaxing, China, 2010.
Panel A-F: (A) Occupational activity, (B) Exercise, (C) Transportation activity, (D) Housework, (E) Overall activity, (F) Sedentary time. The solid lines indicate estimated mean change in PA level and the dotted lines represent 95% confidence intervals. The estimates were adjusted for age, sex, body mass index and waist circumference.

