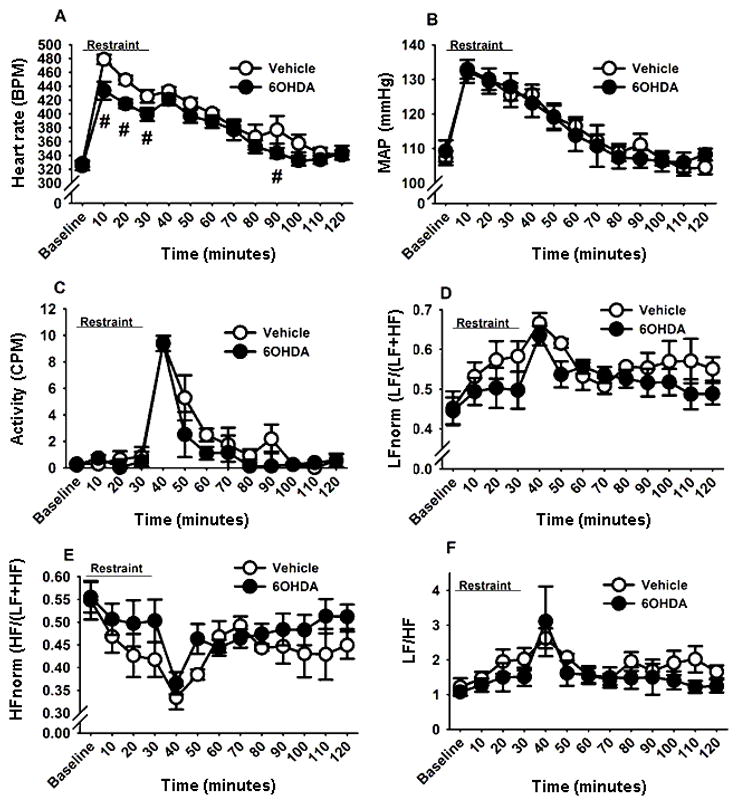
Figure 5. Time course of changes in cardiovascular and HRV parameters during and after exposure to a 30 min acute restraint.

6-OHDA-injected rats exhibited lower HR during the first 30 min of restraint stress and at 60 min after stress cessation (A). A2 lesion did not alter MAP (B), locomotor activity (C), low frequency HRV (D), high frequency HRV (E), or ratio of LF/HF (F) responses to restraint. #Indicates significant difference, p<0.05, from vehicle group: Two-way ANOVA with repeated measures followed by protected Fisher’s post hoc analysis. Data are expressed as mean ± SEM with n= 5–6 per group. List of abbreviations: Heart rate, HR; beats per minute, bpm; mean arterial pressure, MAP; Counts per minutes, CPM; normalized low frequency, LFnorm; normalized high frequency, HFnorm.
