Figure 3.

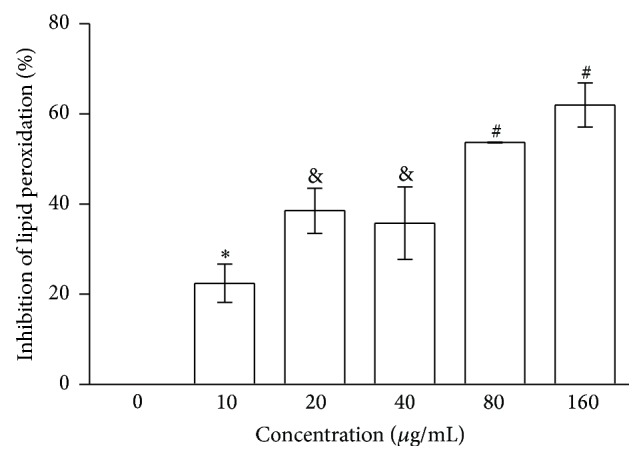
Inhibition of Fenton reaction-induced lipid peroxidation of PT. The results are expressed as the means ± S.E.M. n = 5. ∗Different symbols represent different results within the PT group (p < 0.05, ANOVA/Tukey).

Inhibition of Fenton reaction-induced lipid peroxidation of PT. The results are expressed as the means ± S.E.M. n = 5. ∗Different symbols represent different results within the PT group (p < 0.05, ANOVA/Tukey).