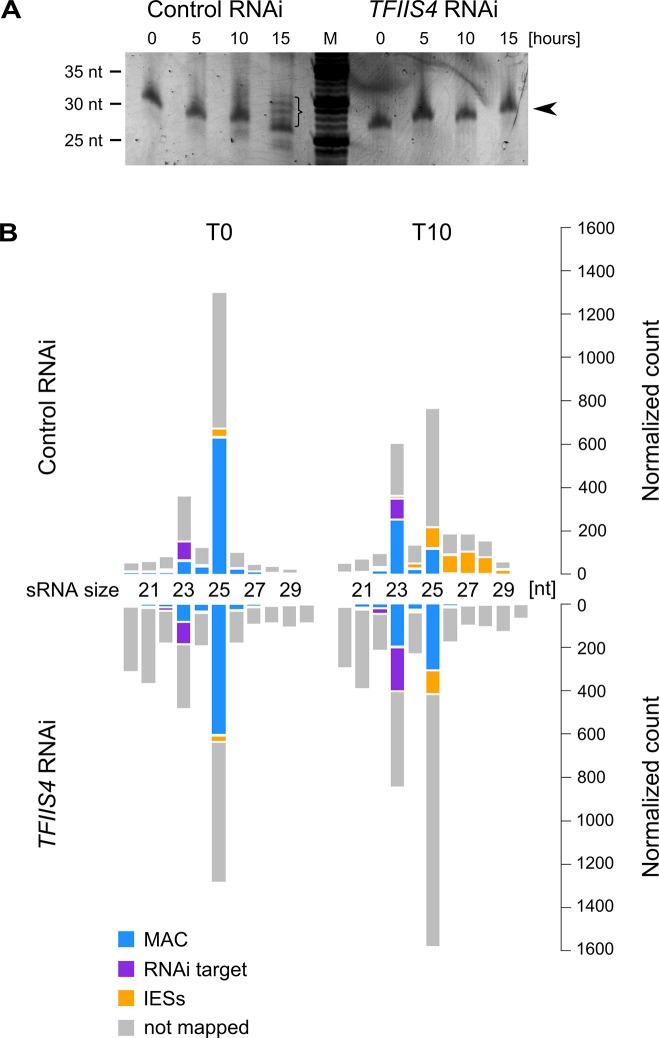
Fig 7. Analysis of sRNA populations in TFIIS4-silenced cells.
(A) Total RNA samples corresponding to the T0, T5, T10 and T15 time-points from the above experiment were run on a denaturing 15% polyacrylamide-urea gel. After electrophoresis the gel was stained with SYBR Gold (Invitrogen). M: DNA Low Molecular Weight Marker (USB). Arrowhead points to the ~25 nt signal that was shown to correspond to the fraction of scnRNAs [15]. In the control, at the T15 time-point, additional bands corresponding to 26–30 nt iesRNAs are present (indicated by a bracket). In TFIIS4-silenced samples iesRNAs can clearly not be seen. (B) Small RNA libraries corresponding to the T0 and T10 time-points from the above experiment were sequenced and mapped to the reference genomes (P. tetraurelia MAC reference genome and MAC+IES reference genome). The top panel corresponds to a control culture (cells silenced for ICL7 gene expression), while results for TFIIS4-silencing are shown below. Histograms show normalized number of sRNA reads that match to: the target silencing regions (ICL7 or TFIIS4 gene, respectively) – in purple; the rest of MAC genome – in blue; all annotated IESs – in yellow; all other not mapped sRNA – in gray.

