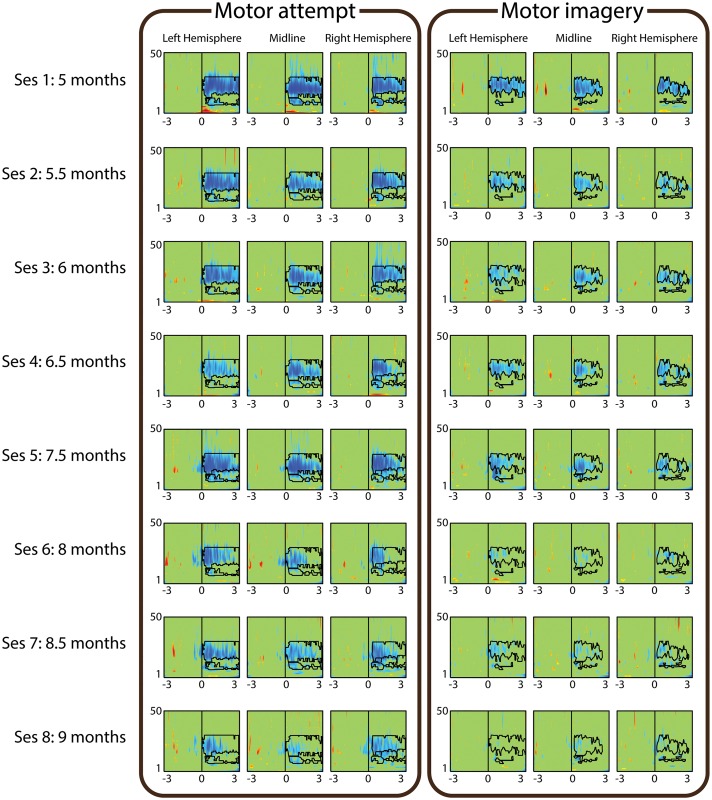
Fig 1. ERD Evolution of patient P02.
ERD maps corresponding to motor attempt (left panel) and motor imagery (right panel). The different rows correspond to the 8 sessions, which were registered between 5 and 9 months after the lesion. The three columns of each panel correspond to the ERD of the left hemisphere, midline and right hemisphere. The x-axes of each map range from -3 to 3 seconds with respect to the attempt/imagery cue presentation, while the y-axes range from 1 to 50 Hz. The α and β regions of interest obtained on the first session for each channel are drawn on each ERD map.

