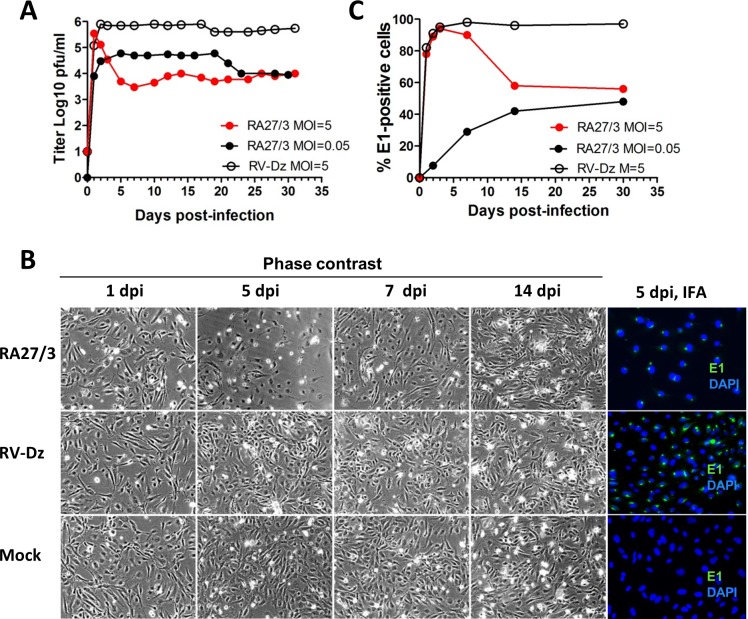
Fig 1. Comparative analysis of vaccine and wtRV persistence in HUVEC.
(A) Growth curves of RA27/3 and RV-Dz at different MOIs. (B) Percentage of E1-positive cells in the infected monolayers at different times post-infection. Representative results of at least two independent experiments are shown. (C) Phase contrast images and results of immunofluorescence assay (E1 staining) of HUVEC infected with RA27/3, RV-Dz or mock-infected at different times post-infection. Nuclei were counterstained with DAPI.

