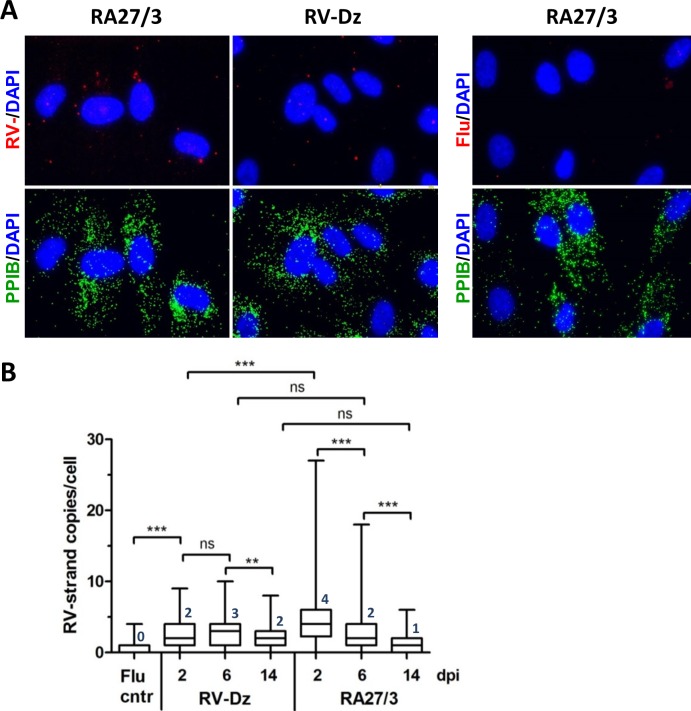
Fig 4. Quantitation of negative-strand RV RNA by in situ hybridization.
(A) The representative images from at least 3 independent experiments showing the results of the RNA-FISH for negative-strand RV RNA and influenza NP-negative strand RNA (negative control) in HUVECs infected with RA27/3 and RV-Dz at 2 dpi. Outlines of cell boundaries were created in the AxioVision software by using PPIB dots as reference points. (B) Distribution of the dots (negative-strand genomic RNA) per cell in infected HUVEC. The dots were counted in 7–10 randomly selected microscopic fields (total 120 cells). The combined data from two separate experiments are presented in a box-and-whisker plot such that the edges of the boxes represent the 25th and 75th percentiles, the horizontal line in the box is the median, and the whiskers show the range of values. Significance was determined using ANOVA, followed by post hoc analysis using the Tukey test for multiple comparisons (**, P < 0.01; ***, P < 0.001).

