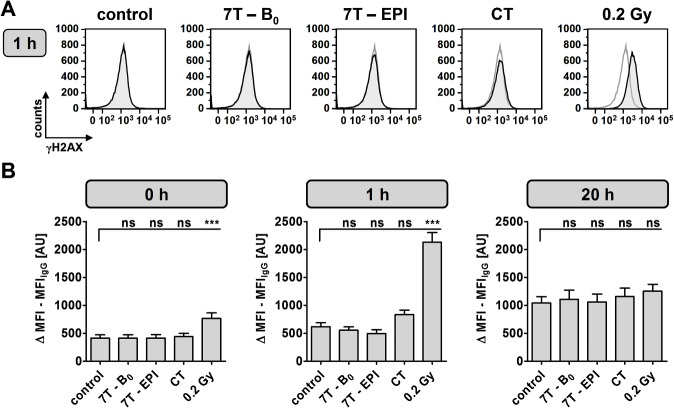
Fig 1. Flow cytometry analysis of γH2AX-stained DNA double-strand breaks.
Mean γH2AX intensity was assessed in PBMCs immediately, 1 h and 20 h after indicated exposure conditions. (A) Representative overlay histogram of γH2AX-intensity 1 h after indicated exposure (black line) and of corresponding control (gray line). (B) Difference of mean fluorescence intensity (MFI) of γH2AX and IgG-isotype control staining from 16 independent experiments at three different time points after exposure as mean ± SEM (***: P ≤ 0.001; ns: P > 0.05).

