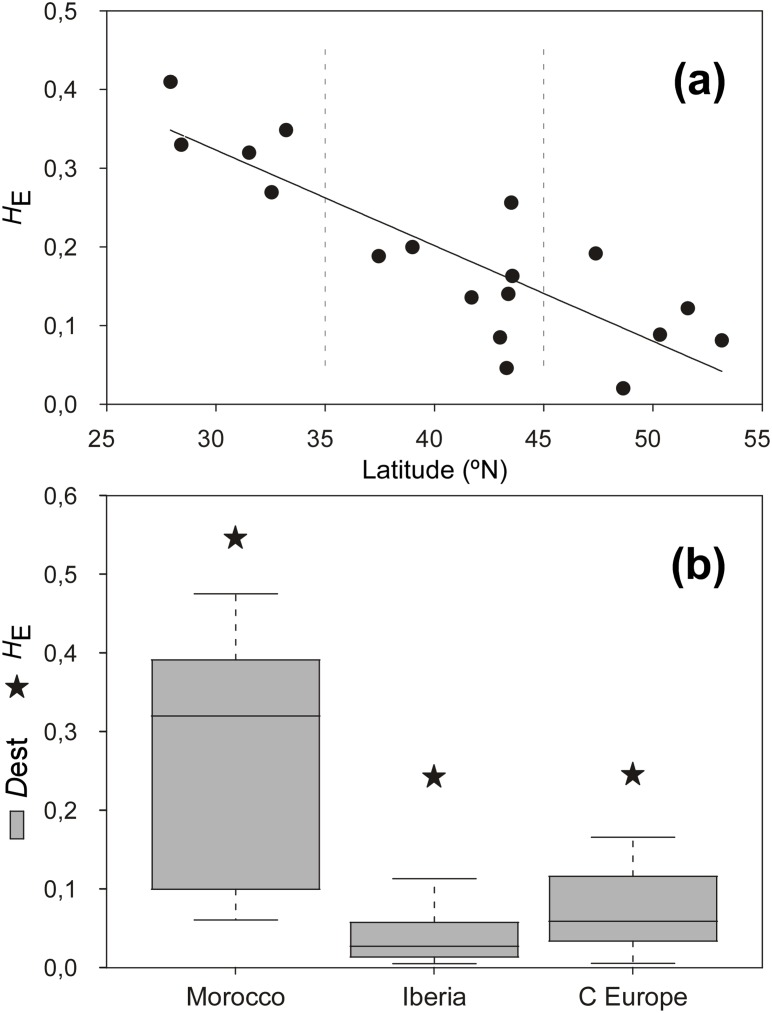
Fig 4. Geographic patterns of (nuclear) genetic diversity and differentiation.
(a) Nei’s gene diversity (H E) of populations regressed against latitude. (b) Box-plot of D est pairwise differentiation of populations and regional H E (stars) within Morocco (N = 5), Iberia (N = 8) and Brittany/British Isles (C Europe, N = 5).

