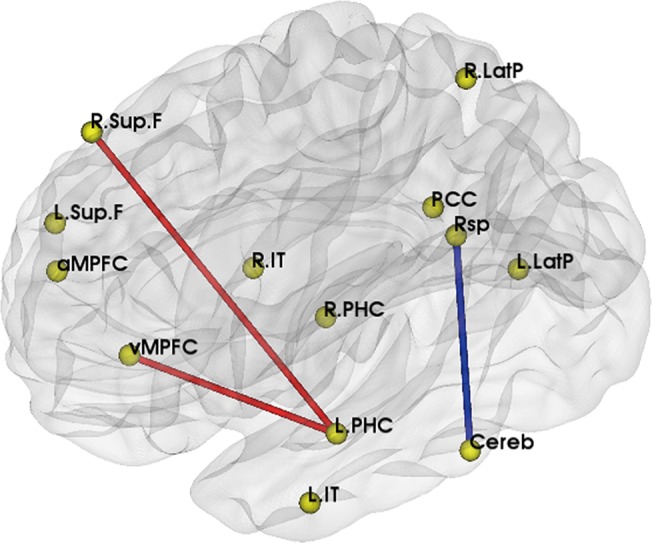
Fig 1. Significantly different DMN functional connectivity between APOE ε4ε3 and ε3ε3.

Brain model for the changed functional connectivity: the red line represented the increased functional connectivity in ε4ε3 carriers, and blue line represented the decreased one.
