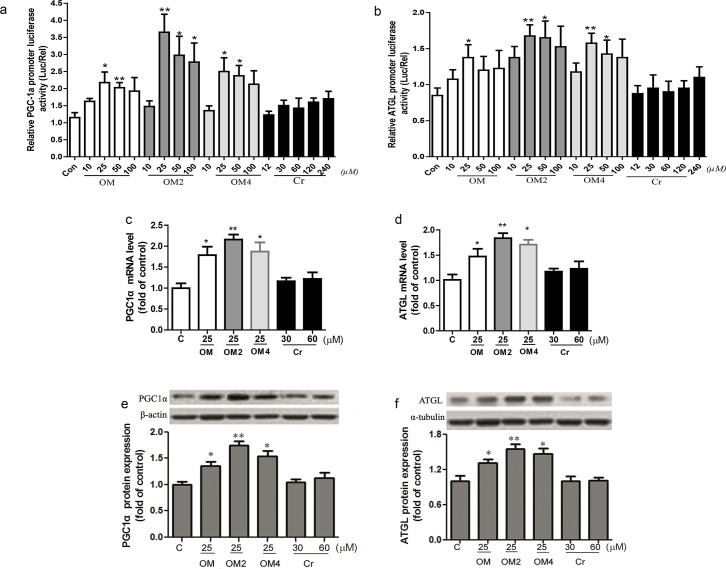
Fig 1. OM2 Stimulated gene transcription and protein expression of PGC1a and ATGL.
Fully differentiated cells were transfected as described above and incubated with different concentrations of OM and its complexes or chromium III for 24 hours. The reporter activity of PGC1a (a) and ATGL (b) were measured by a luciferase assay kit with a luminometer; total RNA of the adipocytes were isolated and analyzed by quantitative RT-PCR with gene-specific oligonucleotide probes for mRNA of PGC1α (c) and ATGL (d). The cycle number at which the various transcripts were detectable was compared with that of 18s rRNA as an internal control; as for protein expression detection, the adipocytes in 6-well plates were treated and subsequently solubilized into SDS sample buffer and analyzed by western blotting with antibodies against β-actin or ɑ-tubulin and objective antibodies. (e) representative of PGC1α protein immunoblots (upper) and quantitative analyzes (lower); (f) representative of ATGL protein immunoblots (upper) and quantitative analyses by densitometry (lower). Results are presented as percentage of untreated control cells. Values are mean ± SEM (n = 4). *p<0.05, **p<0.01 vs control.

