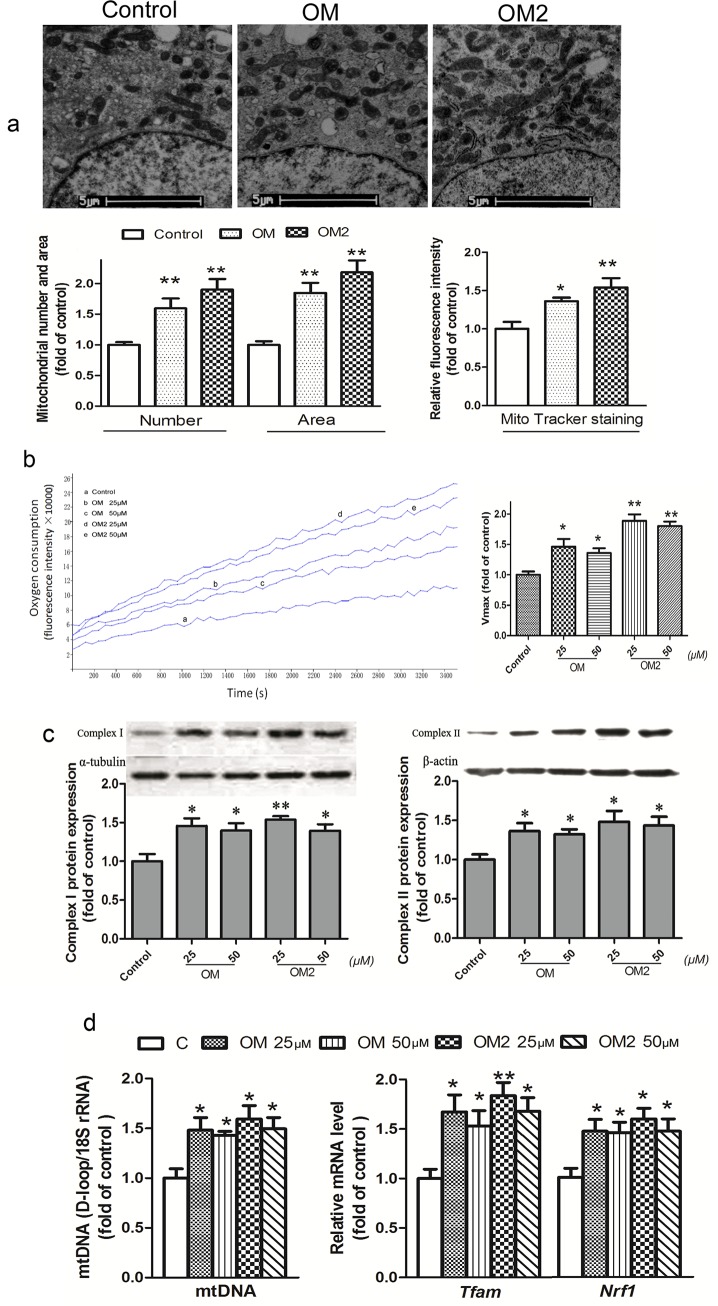
Fig 2. OM2 promoted mitochondrial biogenesis and function.
The fully differentiated adipocytes were treated or untreated for 24 h before analysis; (a) upper, the adipocyte mitochondrial morphometry illustrated by transmission electron microscopy; lower, quantitative analysis of mitochondrial density and surface area by transmission electron microscopy and MitoTracker Green FM staining (100 nmol/l); (b) oxygen consumption in that equal volumes of cells were separated into aliquots in wells of a 96-well BD Oxygen Biosensor plate. Fluorescence in each well was recorded over time. Left, representative oxygen consumption curves; Right, quantitative changes in the respiratory rate of the adipocytes were calculated by determining the kinetic measurements; (c) upper, a representative immunoblot of complex I and II; lower, quantitative analysis by densitometry; (d) mtDNA levels and mRNA levels of Nrf1 and Tfam, total RNA or DNA of the adipocytes were isolated and analyzed by quantitative RT-PCR with gene-specific oligonucleotide probes. The cycle number at which the various transcripts were detectable was compared with that of 18s rRNA as an internal control. All values are mean±SEM of four independent experiments. *p<0.05, *p<0.01 vs control.

