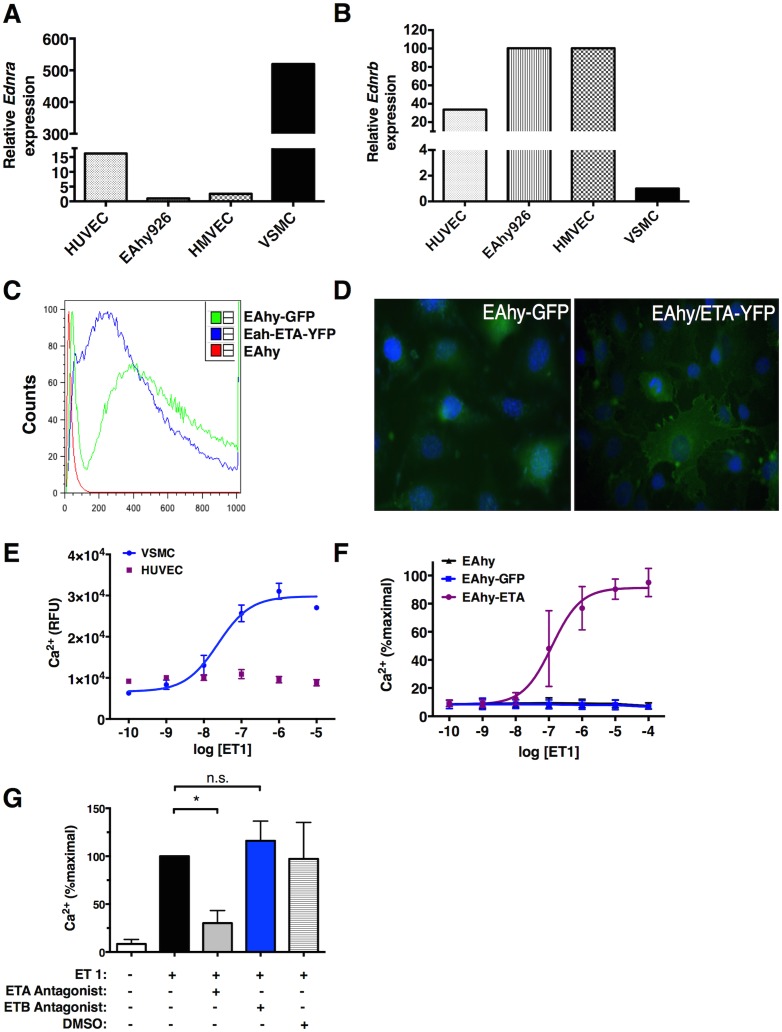
Fig 3. Expression and function of ETA receptors in endothelial cells.
(A-B) Relative Ednra and Ednrb expression in indicated cell lines was determined by qPCR relative to expression in EAhy cells (A) or vascular smooth muscle cells (B) set as ‘1’. (C) EAhy cells were transduced with ETA-YFP or GFP retroviruses followed by selection of flow sorting; relative fluorescence post-sort was determined by flow cytometry. (D) Expression and localization of ETA-YFP or GFP was examined by fluorescence microscopy. (E-G) Ca2+ concentrations were measured in the indicated cell lines following treatment with various concentrations of ET-1 by fluorimetry. In (F) cells were pre-incubated with the indicated receptor antagonists or vehicle alone as a control for one hour prior to stimulation with ET-1 (200 nM). Data are mean ± S.E.M. of 3–4 individual experiments; *p = 0.04, one-way ANOVA.

