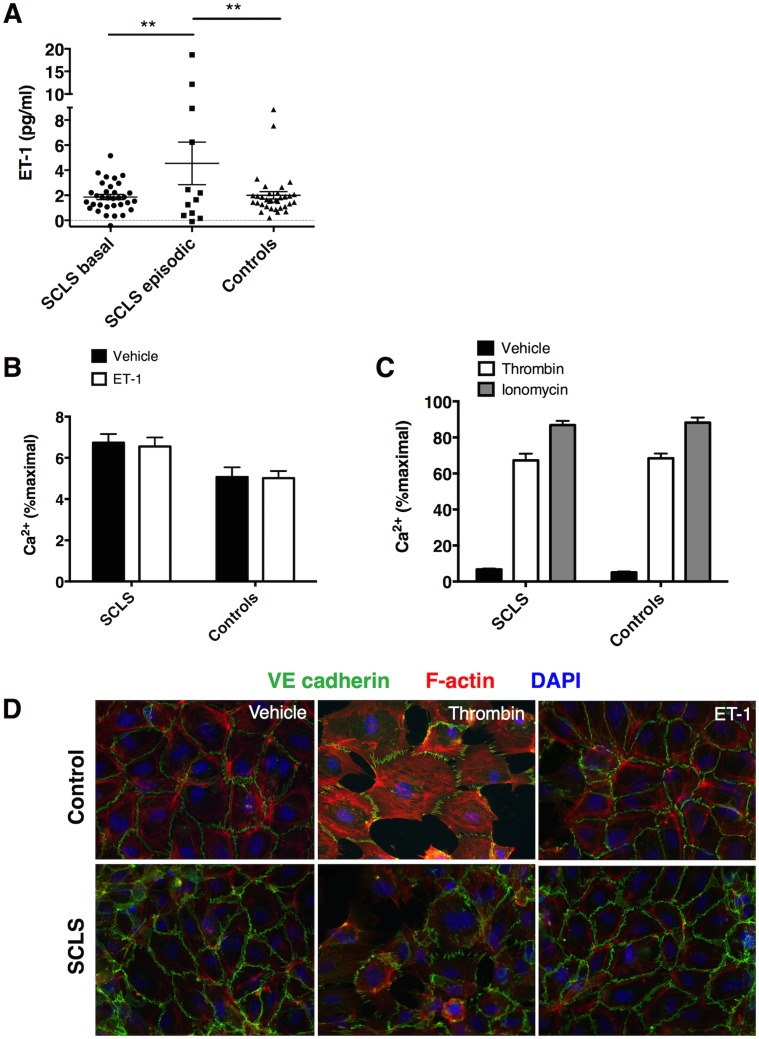
Fig 5. ETA-endothelin-1 axis in SCLS.
(A) Serum ET-1 levels in SCLS sera (basal or acute) or healthy control sera were determined by ELISA. **p = 0.01, one-way ANOVA. (B-C) Intracellular Ca2+ concentrations were determined by fluorimetry as in Fig 3 in BOEC left untreated or stimulated with thrombin (2 U/ml) or ionomycin (1 μM) (B) or), ET-1 (2 μM). Data are mean ± S.E.M. of quadruplicate measurements from a single experiment representative of 3 similar experiments. (D) BOEC were stimulated with thrombin (2 U/ml) or ET-1 (2 μM) for 20 min followed by fixation and staining with phalloidin (F-actin, red), anti-VE-cadherin (green), and DAPI (blue). Images are from a single experiment representative of 3 similar experiments using cells from different donors.

