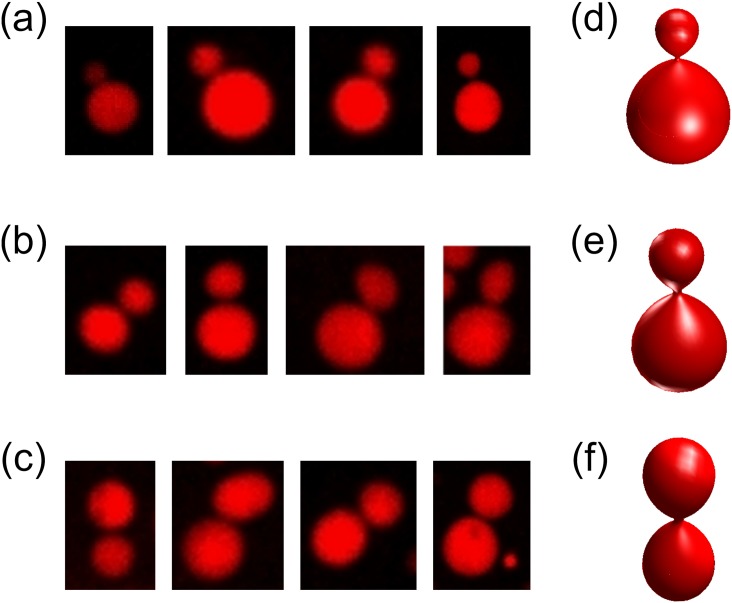
Fig 6. Microscope images of lipid vesicles consisting the peaks (arrowed) of Fig 3.
The concentrations of PEG lipid micelles are (a) 10.32μM, (b) 20.63 μM, and (c) 41.25 μM, which correspond to Fig 3f, 3e, and 3d, respectively. Images of simulated vesicles that look similar to observed vesicles are shown on the right. Parameters of the vesicles are: (d) v = 0.83, Δa = 1.30, (e) v = 0.76, Δa = 1.34, (f) v = 0.69, Δa = 1.39.

