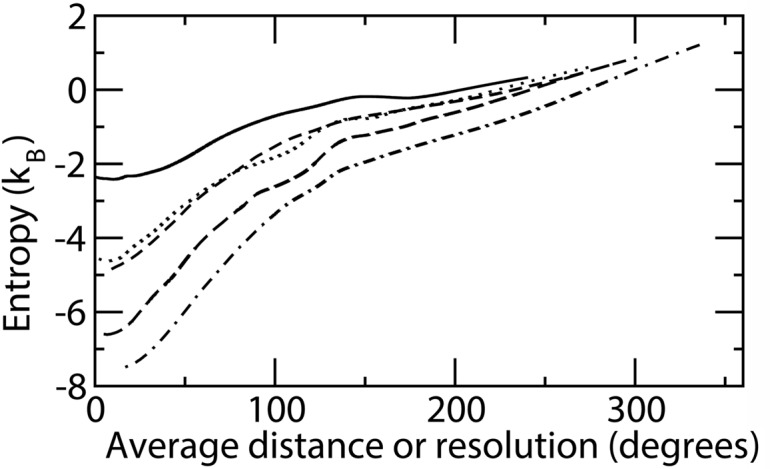
Fig 1. Entropy for residues in unfolded proteins calculated according to the k th nearest neighbor vs. the average distance of the k th nearest neighbor.

Distances are increasing with k. The curves are relative to alanine (continuous line), valine (dotted line), isoleucine (short dashed line), tryptophane (long dashed line) and lysine (dot dashed line).
