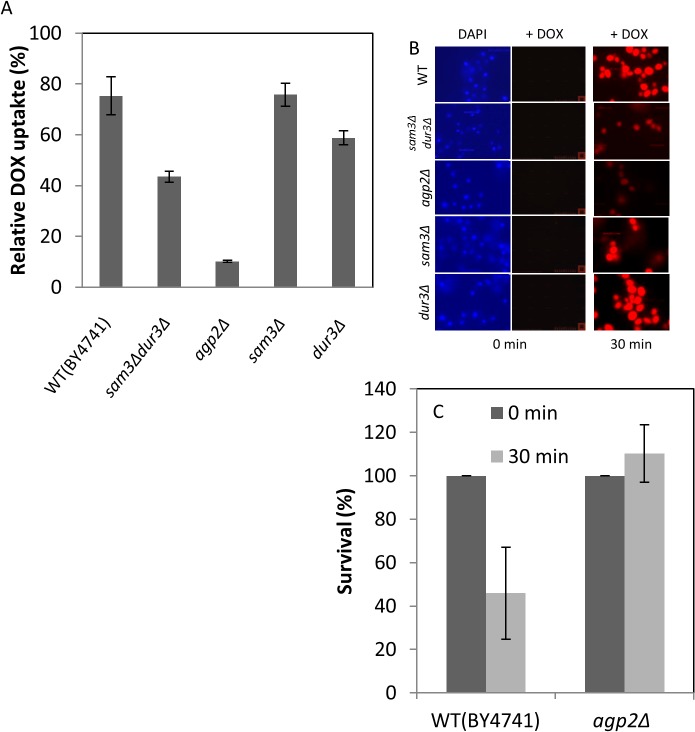
Fig 3. Mutants lacking Agp2 are deficient in DOX uptake and display resistance to the drug.
(A) FACS analysis of DOX uptake levels in the WT and the isogenic mutant strains. Cells were incubated in low YNB in the presence of DOX (800 μM) for 30 min and processed for FACS analysis to quantify the level of drug uptake. The background uptake detected in the presence of normal amount of YNB, which vary between 10 to 20% was subtracted from each analysis to provide the real intracellular uptake of DOX. (B) Epifluorescent microscopy showing the relative accumulation of DOX in the WT and the isogenic mutants. Uptake of DOX (800 μM) for 30 min was performed in low YNB and the cells processed for epifluorescent microscopy. Images were captured with an Olympus epifluorescent microscope equipped with a camera (see materials and methods). (C) Comparison of the surviving fractions of the WT and agp2Δ mutant following exposure to DOX. Uptake was conducted as in panel A, cells diluted and plated for survivors on solid YPD. The results were the averages of two independent experiments.

