Figure 1.
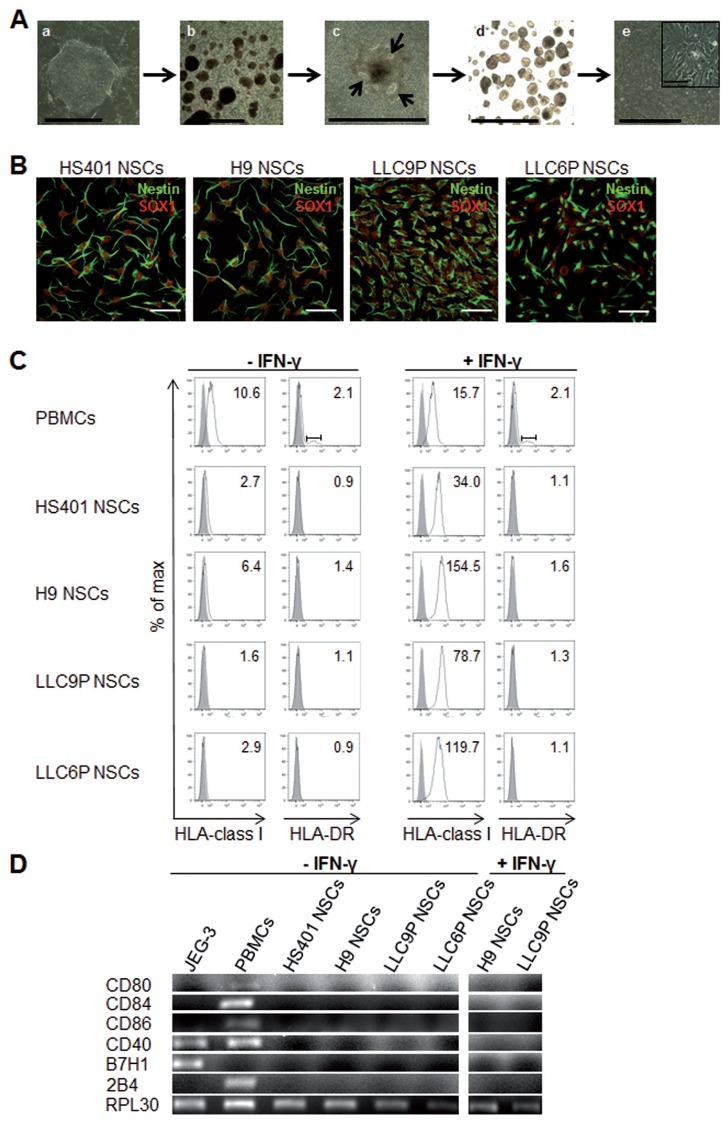
Differentiation of PG hESCs into NSCs and expression of HLA and costimulatory molecules. (A) Phase contrast images of different stages during in vitro neural differentiation: (a) PG hESCs on feeders, (b) floating EBs, (c) attEBs (arrows indicate rosette-like structures), (d) floating neurospheres and (e) NSCs. Scale bar: 0.15 nm. Magnification showed NSCs. Scale bar: 0.1 mm. (B) Confocal images of NSC cultures immunostained with NSC-specific markers SOX1 (red) and Nestin (green) in PG and control N NSCs. Scale bar: 50 μm. (C) Flow cytometry of untreated (left) or 48 h IFN-γ-treated (25 ng/mL) (right) NSC cultures. Cells were stained with monoclonal antibodies specific for HLA class I or HLA-DR. Histograms show specific fluorescence signal for HLA class I or -DR (black lines) compared with isotype control (filled gray). Specific fluorescence indexes (SFI: specific geometric median/geometric median of unspecific control) are indicated in the upper right. (D) RT-PCR analysis for expression of costimulatory molecules in untreated PG and N NSCs and in IFN-γ treated NSCs. JEG-3 cells and PBMCs were shown as controls and RPL30 as housekeeper gene.

