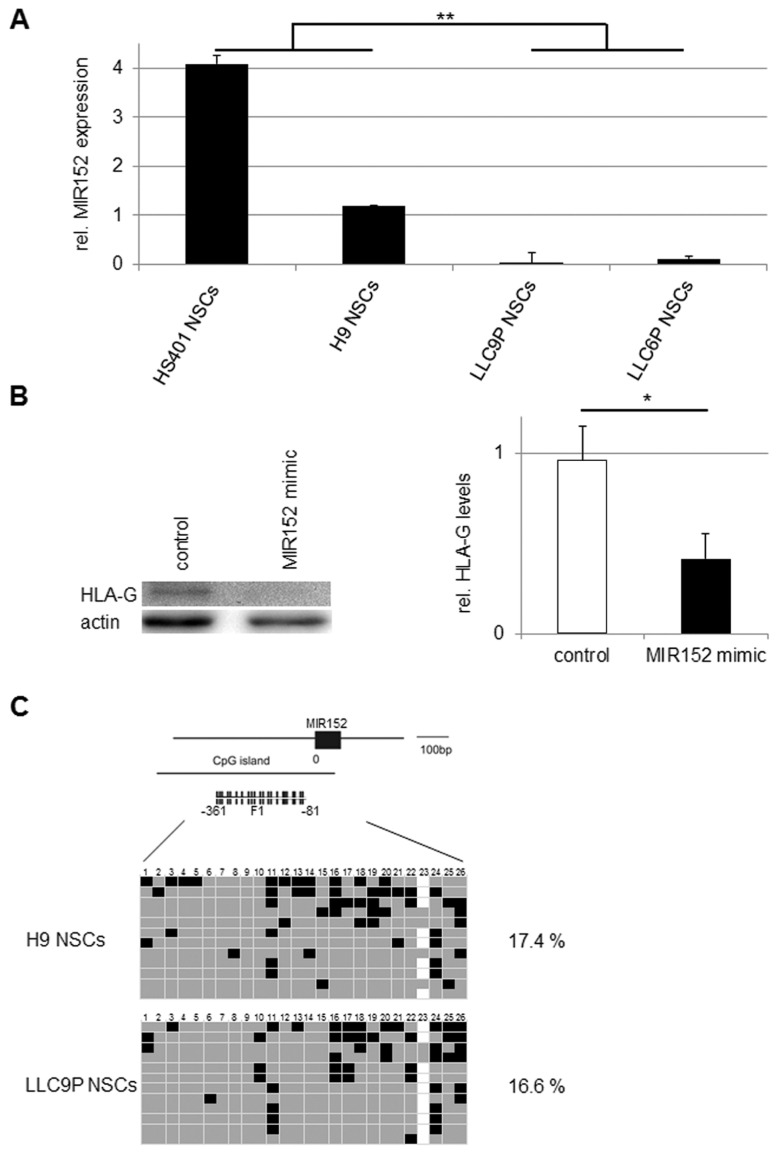
Figure 5.
MIR152 expression in PG NSCs. (A) Real-time RT-PCR analyses of MIR152 expression in PG and N NSCs normalized to the housekeeper gene U6. Gene expression was calculated with the 2−ΔΔCt method; MIR152 gene expression in PBMCs was set to 1. **p < 0.001; n = 3. (B) Overexpression of MIR152 in LLC9P NSCs. Western blot analysis of HLA-G (MEM-G/1) in PG (LLC9P) NSCs transfected with anti-GAPDH (control) or MIR152 mimic double-stranded oligonucleotides. Actin was used as loading control (left panel). Densitometric analysis of three independent western blots was performed using ImageJ. HLA-G protein levels were normalized to actin. *p < 0.05 (right panel). (C) Analysis of CpG methylation of the MIR152 promoter in PG and N NSCs. F1 represents the genomic region selected for bisulfite sequencing. Each row represents a separate DNA molecule (clone); CpG numbers are indicated on top. Gray and black boxes represent unmethylated and methylated CpG dinucleotides, respectively; white boxes: no data. Percentages of CpG methylation are indicated. n = 2.

