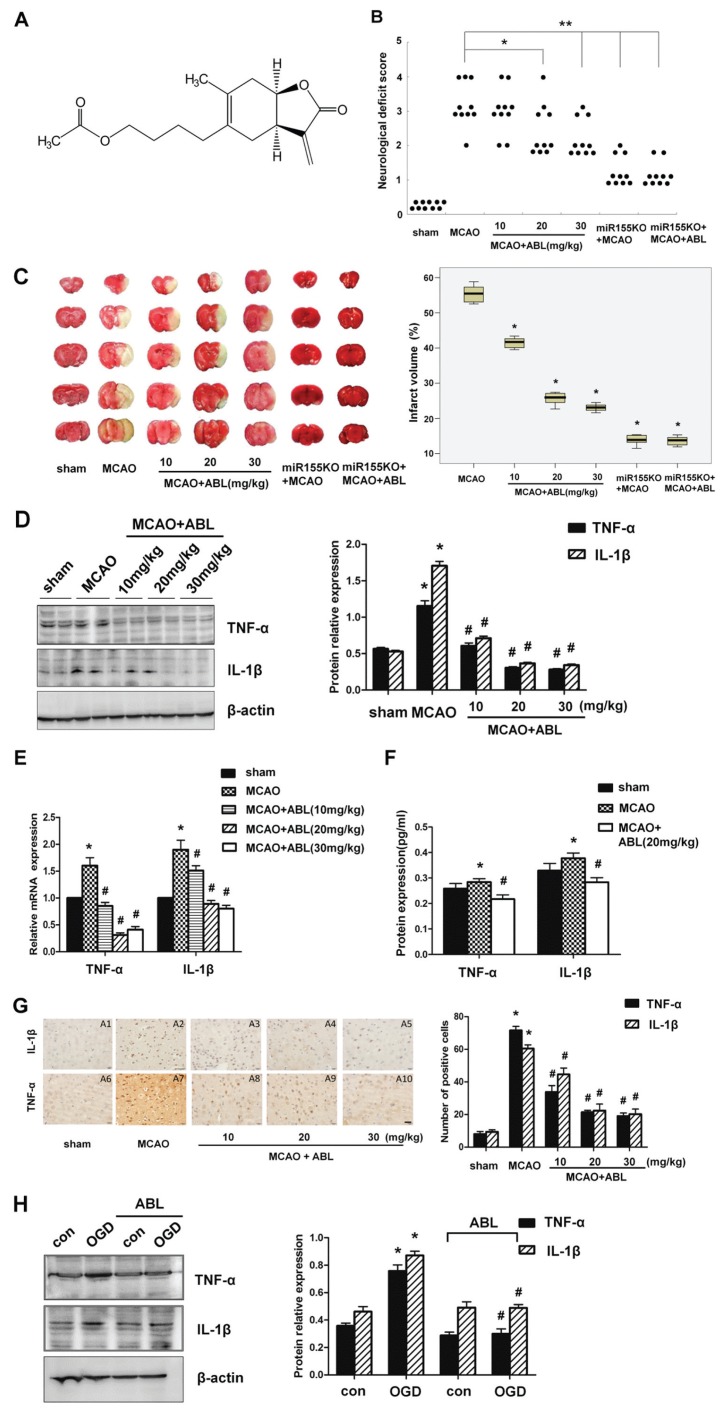
Figure 1.
ABL decreases inflammatory responses induced by focal cerebral ischemia. (A) The chemical structure of ABL. 1-O-acetylbritannilactone(R)-4([3aS,4S,7aR]-4-hydroxy-6-methyl-3-methylene-2-oxo-2, 3, 3a, 4, 7, 7a-hexahydrobenzofuran-5-yl) pentyl acetate. (B) Neurological deficit scores were assessed 24 h after MCAO. n = 10 per group. (*P < 0.05 versus MCAO group; **P < 0.01 versus MCAO group, Mann-Whitney U test). (C) left, Representative TTC-stained coronal sections of mouse brain, showing cerebral infarction volume in each group of mice; right, Bar graphs show the infarct volume (%) of each group of mice. Data are means ± SD (n = 6 per group) *P < 0.05 versus MCAO group. (D) left, The protein levels of TNF-α and IL-1β in brain tissues of sham, MCAO and MCAO + ABL-treated groups were measured by Western blotting; right, Band intensities that were normalized to β-actin are represented by bar graphs as the means ± SD (n = 6 per group), *P < 0.05 versus sham group; #P < 0.05 versus MCAO group. (E) mRNA levels of TNF-α and IL-1β in brain tissues of sham, MCAO and MCAO + ABL-treated groups were determined by qRT-PCR. Bars represent means ± SD (n = 6 per group); *P < 0.05 versus sham group; #P < 0.05 versus MCAO group. (F) Bar graphs show the protein concentrations of TNF-α and IL-1β in brain tissues of sham, MCAO, and MCAO + ABL-treated groups, as measured by ELISA. Data are presented as means ± SD (n = 6 per group);. *P < 0.05 versus sham group; #P < 0.05 versus MCAO. (G) Immunohistochemical staining for TNF-α and IL-1β in brain tissues of sham, MCAO and MCAO + ABL-treated groups. Scale bar = 20 μmol/L. Bars represent the number of TNF-α- and IL-1β-positive cells. n = 5 per group; *P < 0.05 versus sham group; #P < 0.05 versus MCAO group. (H) BV2 cells were treated with or without ABL (100 μmol/L) for 24 h prior to OGD. TNF-α and IL-1β were detected by Western blotting, and band intensities that were normalized to β-actin are represented by bar graphs as the means ± SD from three independent experiments; *P < 0.05 versus con group; #P < 0.05 versus OGD group.

