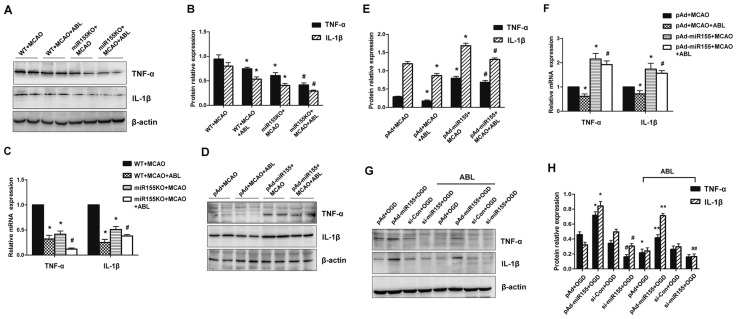
Figure 4.
ABL suppresses miR-155-mediated inflammatory responses in the ischemic cerebral tissue and BV2 microglial cells. (A) Total proteins were extracted from brain tissues of MCAO WT and miR-155−/− mice treated with or without ABL (20 mg/kg) and analyzed by Western blotting for TNF-α and IL-1β. (B) Band intensities in panel A that were normalized to β-actin are represented by bar graphs as the means ± SD (n = 6 per group); *P < 0.05 versus WT + MCAO; #P < 0.05 versus miR-155KO + MCAO. (C) mRNA levels of TNF-α and IL-1β in brain tissues of MCAO WT and miR-155−/− mice treated with or without ABL (20 mg/kg) were detected by qRT-PCR. Bars represent means ± SD (n = 6 per group); *P < 0.05 versus WT + MCAO; #P < 0.05 versus miR-155KO + MCAO. (D) WT mice were infected with pAd or pAd-miR-155 and treated with or without ABL (20 mg/kg). TNF-α and IL-1β 24 h after MCAO were detected by Western blotting. (E) Band intensities in panel D that were normalized to β-actin are represented by bar graphs as the means ± SD (n = 6 per group); *P < 0.05 versus pAd + MCAO; #P < 0.05 versus pAd-miR155 + MCAO. (F) mRNA levels of TNF-α and IL-1β in brain tissues of pAd- or pAd-miR-155-infected MCAO mice treated with or without ABL (20 mg/kg) were detected by qRT-PCR. Bars represent means ± SD (n = 6 per group); *P < 0.05 versus pAd + MCAO; #P < 0.05 versus pAd-miR155 + MCAO. (G) BV2 cells were infected with pAd-miR-155 or si-miR-155, and then treated with or without ABL (100 μmol/L) for 24 h prior to OGD. TNF-α and IL-1β were detected by Western blotting. (H) Band intensities in panel G that were normalized to β-actin are represented by bar graphs as the means ± SD from three independent experiments; *P < 0.05 versus pAd + OGD; #P < 0.05 versus si-Con + OGD; **P < 0.05 versus pAd-miR155 + OGD; ##P < 0.05 versus si-miR155 + OGD.

