Figure 1.
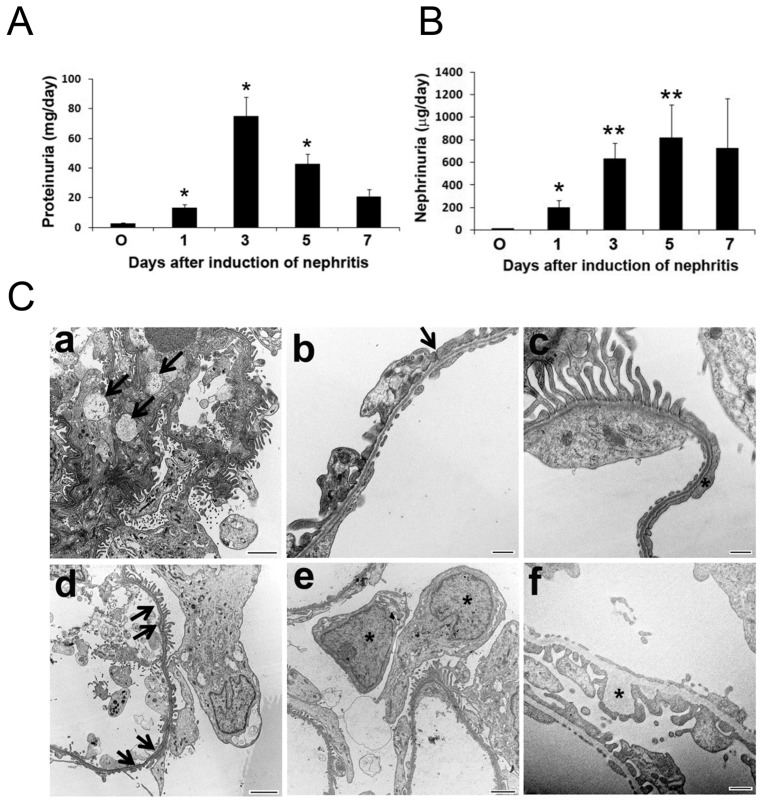
Induction of anti-Thy1 nephritis resulted in increased urinary protein excretion (A) and urinary nephrin excretion (B). Each bar represents the mean ± SEM for a group of three to six rats. *p < 0.05; **p < 0.01 versus control at d 0. (C) Representative transmission electron micrographs showing kidney sections of rats after nephritis induction at different time points. (a) changes of the mesangial matrix (arrows) on d 1; (b) deformation of foot processes and loss of slit diaphragms (arrow) on d 1; (c) effacement of foot processes (asterisk) and (d) disruptions of endothelial layer of the filtration barrier (arrows) on d 3; (e) podocytes (asterisks) detached from glomerular basement membrane in the urinary space on d 3; (f) irregular thickening of glomerular basement membrane (asterisk) on d 5. Bar size, 2 μm (a, d, e); 500 nm (b, c, f).

