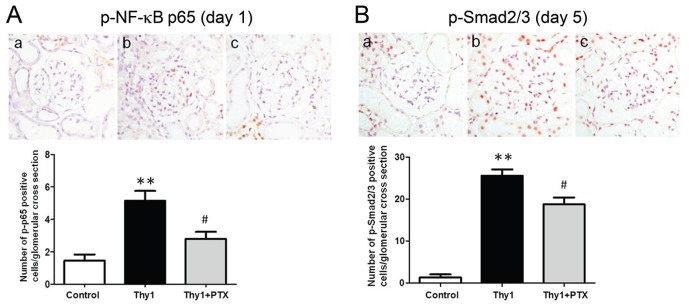
Figure 6.
Representative immunohistochemical staining showing p-NF-κB p65 (A) and p-Smad2/3 signals (B) on d 1 and 5, respectively (a, b and c denote control rats, vehicle-treated nephritic rats and PTX-treated nephritic rats, respectively; original magnification 400×). Bar graphs show semiquantitative results of p-p65–positive and p-Smad2/3–positive cells per glomerular cross-section. Values are the mean ± SEM of 25–30 glomeruli. **p < 0.01 versus control rats; #p < 0.05 versus vehicle-treated nephritic rats. Thy1, vehicle-treated nephritic rats; Thy1 + PTX, PTX-treated nephritic rats.

