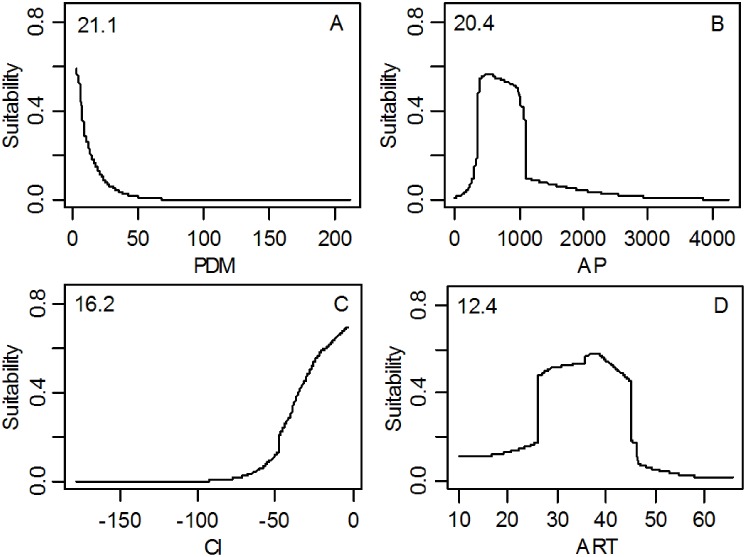
Fig 5. The response curve of climatic suitability for four dominant climatic factors and their relative importance showing in the upper-left corner of each subplot.
(A) Precipitation of the driest month (PDM, mm); (B) Annual precipitation (AP, mm); (C) Coldness index (CI, °C); (D) Annual range of temperature (ART, °C); Exponential response curve (PDM, CI); Unimodal response curve (AP, ART).

