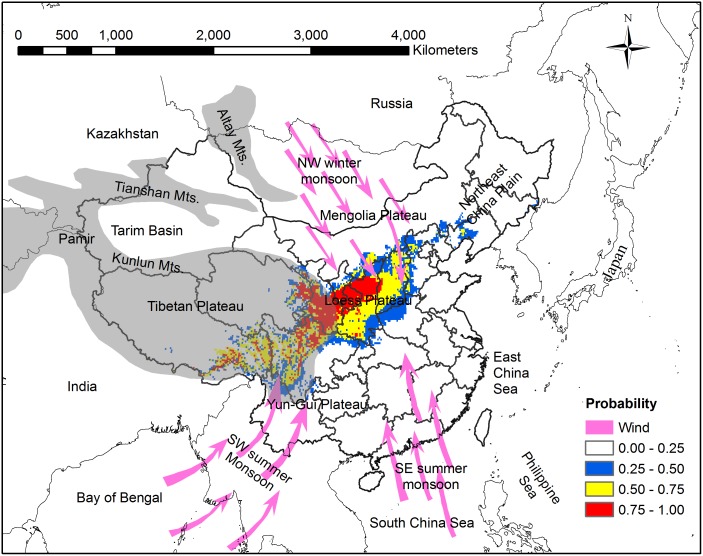
Fig 6. Multivariate environmental similarity surface (MESS) map of novel habitat.
Coarse blue polygon represents potential distribution range of Chinese sea buckthorn using threshold of 0.5. Red color represents interpolation habitat (positive value), green color represents extrapolation habitat (negative value), and orange represents marginal habitat (near zero).

