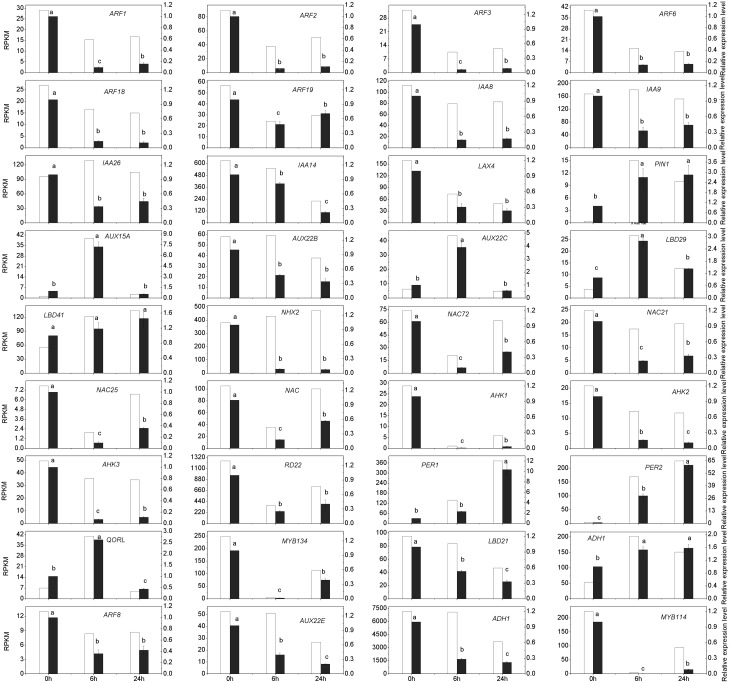
Fig 6. Validation of selected genes involved in adventitious rooting by qRT-PCR.
The gene expression levels measured by qRT-PCR were compared with that of RNA-Seq. White histograms represent expression levels determined by RNA-Seq in RPKM units (left axis), while grey columns represent gene expression levels determined by qRT-PCR and normalized to three control genes (right axis). Bars represent the mean (± SE) of three experiments. Different letters (a, b, and c) represent statistically significant differences (P < 0.01) among the data of qRT-PCR, analysed using Student’s t-test.

