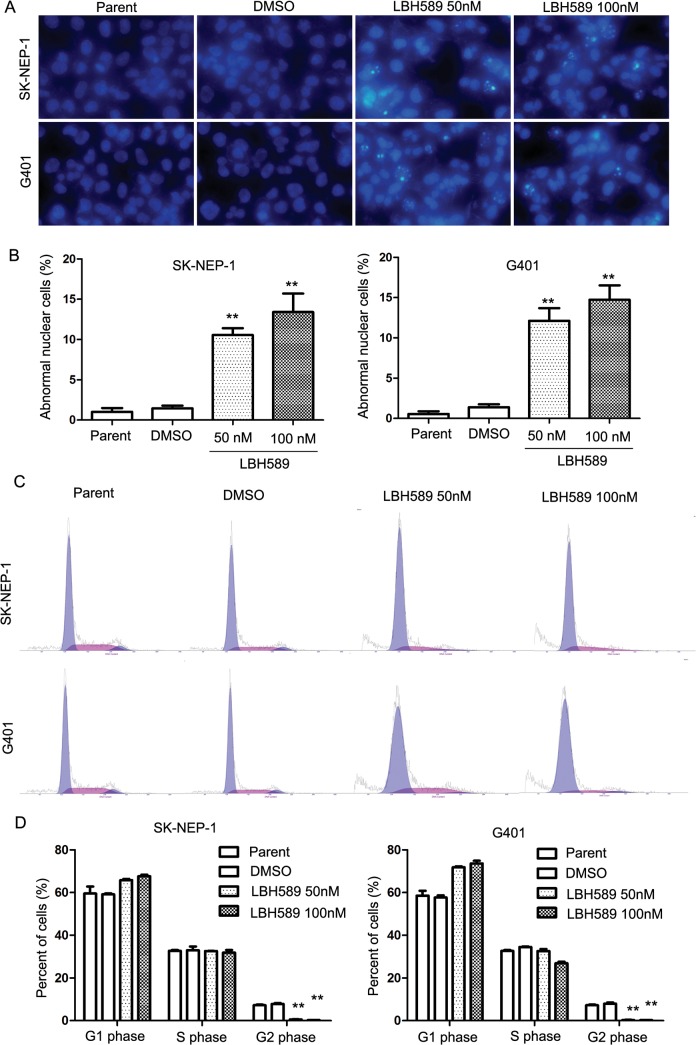
Fig 3. LBH589 induced DNA fragmentation and cell cycle disorder in SK-NEP-1 and G401 cells.
(A) Micrographs following Hoechst 33342 staining of cells treated with LBH589 (50 nM and 100nM) for 24 h. This demonstrates micrograph shows the induction of DNA fragmentation and abnormal nuclear cell formation. The abnormal nuclear cells increased significantly with LBH589 treatment compared with mock treatment in both SK-NEP-1 and G401 cells. ** P < 0.01. (B) The number of cells with abnormal nuclei increased significantly compared with the control group in both SK-NEP-1 (100nM 13.4% ± 3.99% vs. DMSO 1.47% ± 0.57%, respectively; P = 0.033) and G401 cells (100nM 14.73% ± 3.09% vs. DMSO1.40 ± 0.61%, respectively; P = 0.015). (C) Cell cycle analysis of SK-NEP-1 and G401 cells treated for 24 h with LBH589 at 50nM or 100nM compared with DMSO control mock treatment. The number of cells in the G2 phase of the LBH589 treatment group decreased significantly. (D) G2 phase in SK-NEP-1 (100nM 0.2% ± 0.0% vs. DMSO 7.81% ± 0.59%, respectively; P = 0.035) and G401 cells (100nM 0.18% ± 0.0% vs. DMSO7.96 ± 0.80%, respectively; P = 0.046). All analyses were repeated three times. ** P < 0.01.

