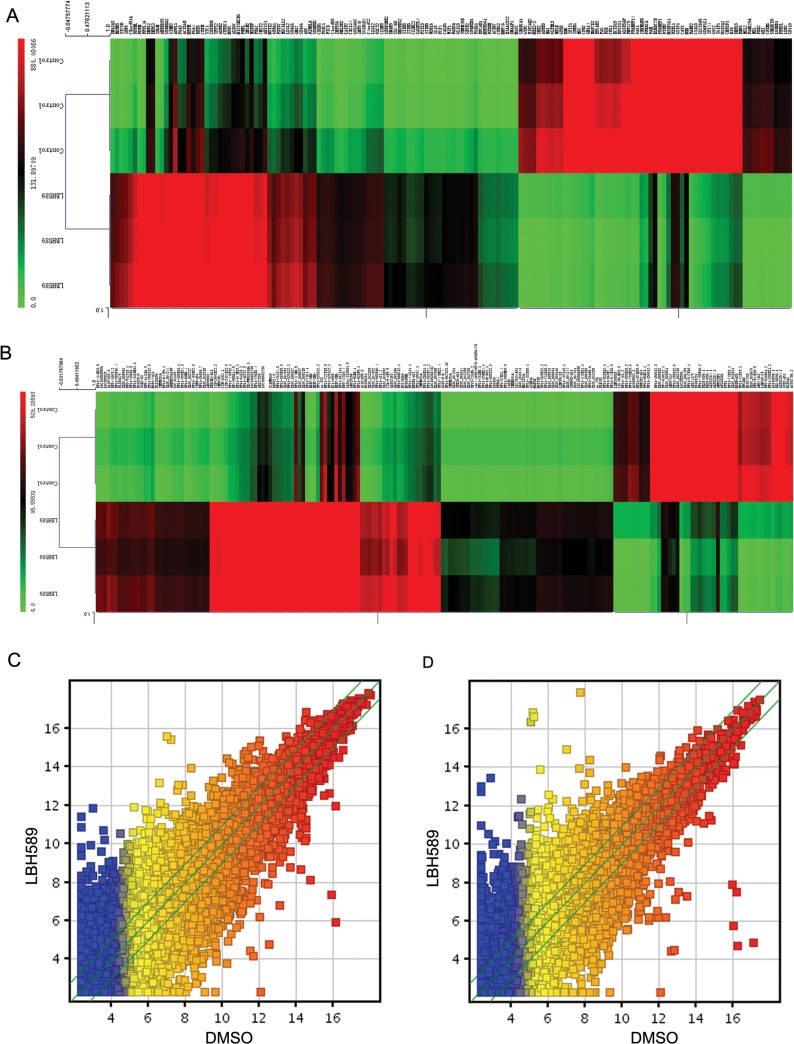
Fig 6. Cluster analysis of differentially expressed genes and lncRNAs in LBH589-treated SK-NEP-1 cells.
The Arraystar_Human_LncRNA_8x60k v3.0 1 microarray was used to identify differentially expressed lncRNAs and mRNAs in LBH589-treated SK-NEP-1 cells compared to DMSO-treated control cells. (A) Hierarchical clustering analysis of the 664 significantly up regulated mRNAs and 632 significantly downregulated mRNAs ≥ 5- fold in LBH589-treated SK-NEP-1 cells. (B) Hierarchical clustering analysis of the differently expressed lncRNAs with a fold change ≥ 5-fold in LBH589-treated SK-NEP-1 cells. (C) Scatter-Plot assessing the mRNAs expression variation between DMSO-treated control cells and LBH589-treated SK-NEP-1 cells. The green lines are Fold Change Lines (The default fold change value given is 2.0). The mRNAs above the top green line and below the bottom green line indicated more than 2.0 fold change of mRNAs between the two compared samples. (D) Scatter-Plot assessing the lncRNAs expression variation between DMSO-treated control cells and LBH589-treated SK-NEP-1 cells. The green lines are Fold Change Lines (The default fold change value given is 2.0). The lncRNAs above the top green line and below the bottom green line indicated more than 2.0 fold change of lncRNAs between the two compared samples.

