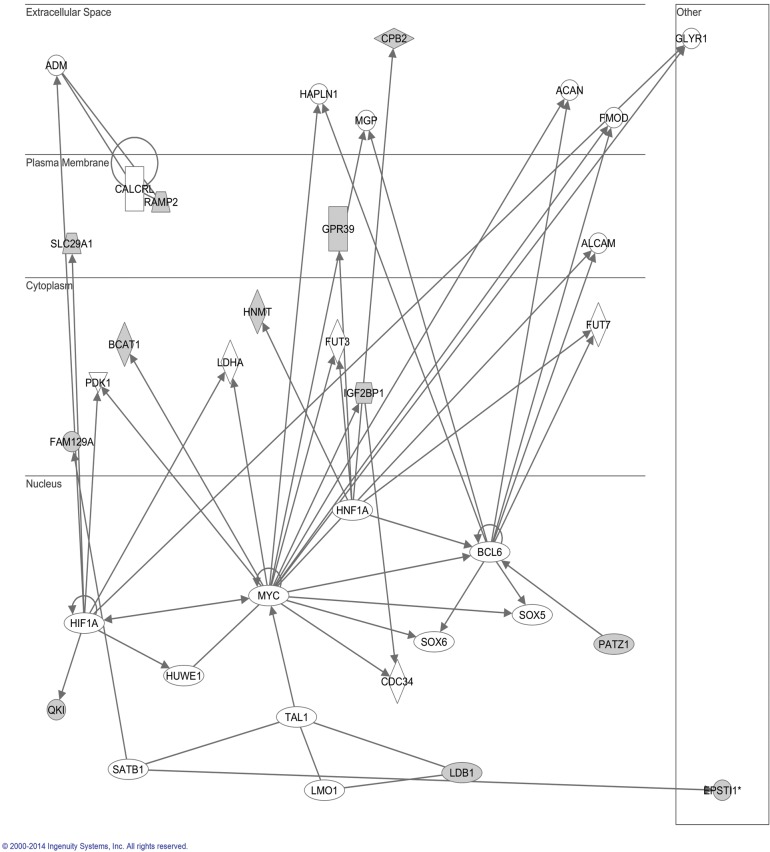
Fig 9. Ingenuity Pathways Analysis (IPA) summary of down regulated genes in SK-NEP-1 cells treated with LBH589.
To investigate possible interactions of differently regulated genes, datasets representing down regulated genes in SK-NEP-1 cells treated with LBH589 were imported into the Ingenuity Pathway Analysis Tool. The following data are shown: most highly rated network in IPA analysis. The network representation of the most highly rated network. Statistical analysis determined that the shaded genes are significant. A solid line represents a direct interaction between the two gene products and a dotted line means there is an indirect interaction.

