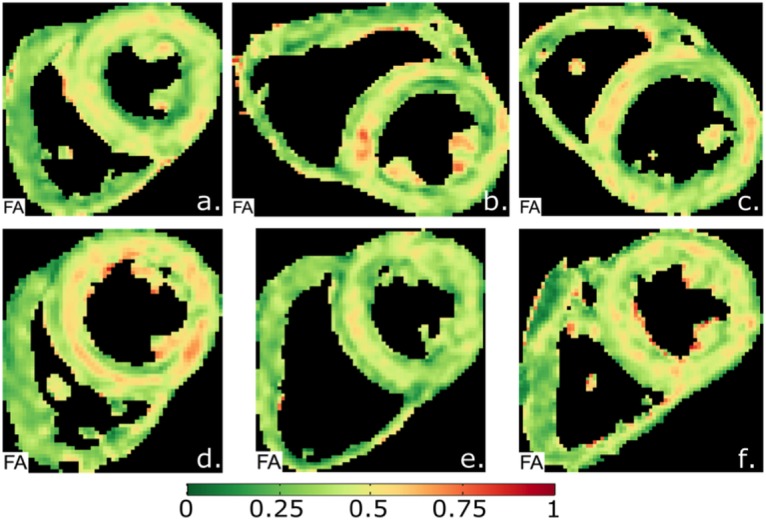
Fig 4. Typical examples of fractional anisotropy (FA) maps.

The maps show a circumferential increase in FA (red) in the mesocardium, indicating a more anisotropic composition of myocytes compared to the endo- and epicardium.

The maps show a circumferential increase in FA (red) in the mesocardium, indicating a more anisotropic composition of myocytes compared to the endo- and epicardium.