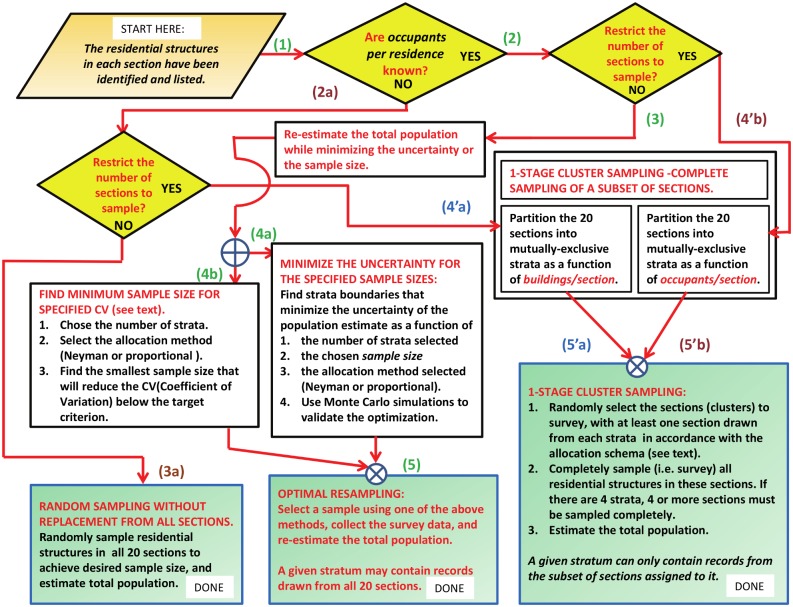
Fig 1. Flow chart for stratified sampling protocols.
This figure summarizes all of the optimization and control protocols for stratified sampling developed in this study. See text for a summary of each major protocol and its corresponding steps through the flow chart. The light brown parallelogram is the starting point for all protocols, the yellow diamonds are decision boxes, and the light green squares denote the process end states.

