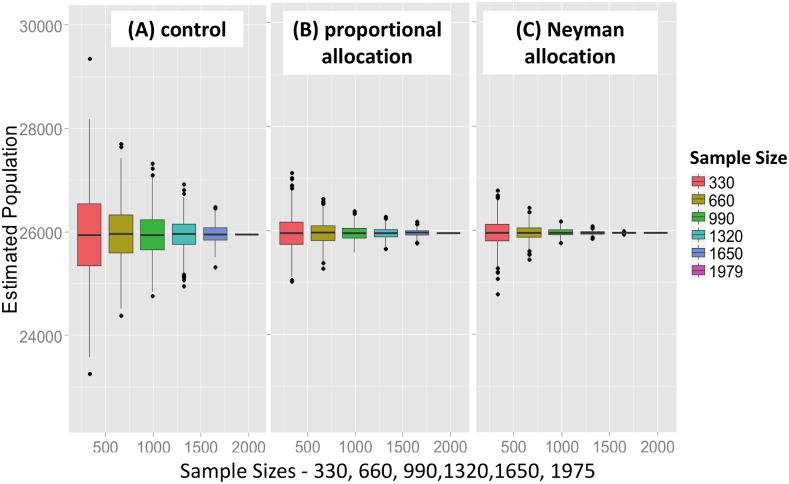
Fig 2. Relative uncertainty of optimized Horvitz-Thompson population estimates.
Quantile boxplots (0.25, 0.75) showing the distribution of the stratified Horvitz-Thompson population estimates as a function of sample size and stratification protocol. The bar in each box is the median value of the estimate, while outliers deviating by one or more quantiles from the median are denoted as discrete points. (A) control—all 20 sections are placed in a single stratum (B) 4 strata, with proportional allocation for sample selection (C) 4 strata, with Neyman allocation for sample selection. Persons per residence was used as the stratification variable, and there were 1,000 simulations for each boxplot.

