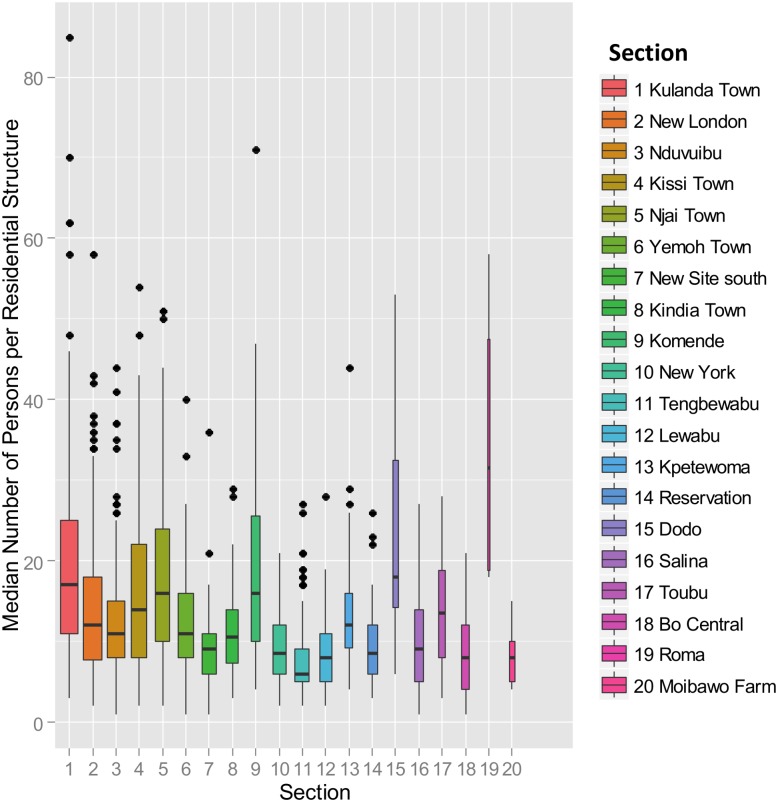
Fig 4. Quantile boxplots for each of the 20 sections.
For each section, a quantile boxplot (0.25, 0.75) shows the distribution of the number of persons per residence, arranged in descending order of total section population. The bar in each box is the median value, while outliers deviating by one or more quantiles from the median are denoted as discrete points. The width of each box is proportional to the square root of the number of residential structures (i.e., records) in the section. Roma is an anomaly with 4 residential structures, and 139 total persons.

