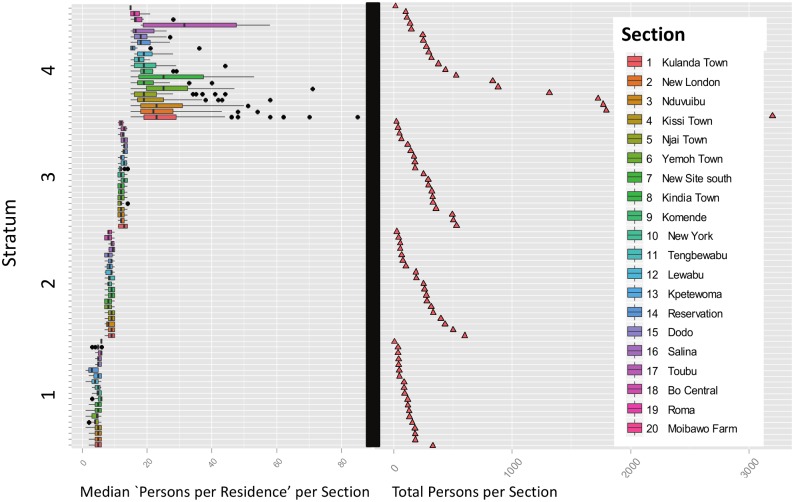
Fig 5. Quantile boxplots for optimal 4-level stratification by “persons per residence.”.
The 4-level stratification variable is “persons per residence” (Table 2-d). The quantile boxplots [0.25, 0.75] show the partitioning of the records by stratum for all 1,979 records. The bar in each box is the median value of persons per residence, while outliers deviating by one or more quantiles from the median are denoted as discrete points. The samples in a given stratum may be assigned from any of the 20 eligible sections. The optimized Neyman allocation has completely separated the 4 strata with respect to overlapping values of the stratification variable.

