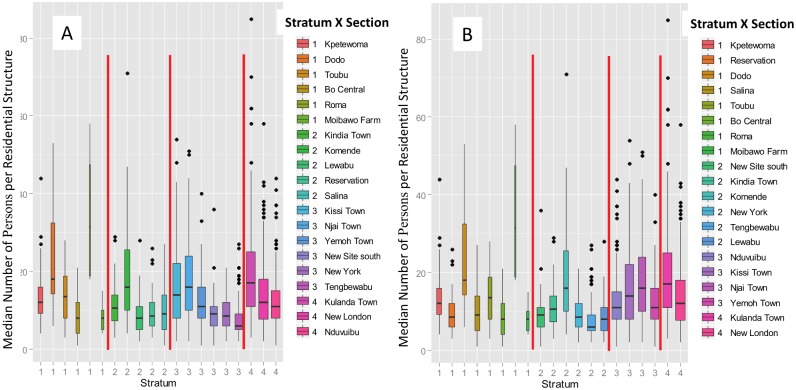
Fig 6. Quantile boxplots for single-stage cluster stratification by (A) “residential structures per section” and (B) “total persons per section”.
(A) For the single-stage cluster sampling, the 20 sections were partitioned into 4 proportionally-allocated stratification levels. Within each stratum, the sections are arranged in descending order of total persons. The stratification variable is the total number of residential buildings per section (see Table 4). The quantile boxplots show the partitioning by stratum of the 1,979 records in the database, although only a subset of 4 sections will be drawn on a single simulation trial. The bar in each box is the median value of “persons per residence,” while outliers deviating by one or more quantiles from the median are denoted as discrete points. (B) Quantile boxplots showing stratification by total persons per section. This stratification approach requires that the population of each section be known, in contrast to stratification by residential structures per section.

