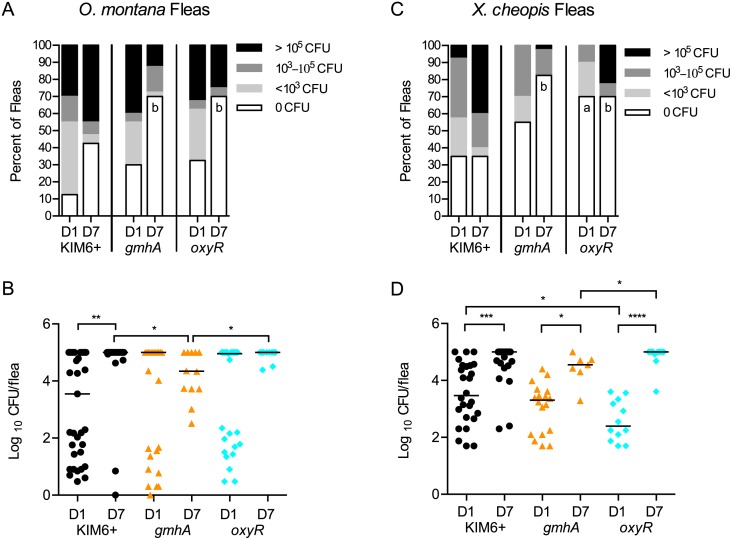
Fig 7. Colonization of Y. pestis mutants in O. montana and X. cheopis fleas.
O. montana (panels A-B) or X. cheopis (panels C-D) fleas fed on blood containing 1x10⁹ CFU of the indicated Y. pestis strains. On days 0, 1 (D1) and 7 (D7) post-infection, fleas were mechanically disrupted and enumerated on heart infusion agar. Day 0 data are shown in S2 Fig. Panels A and C: Fleas were grouped according to their bacterial burden and are represented as a percentage of the total population for that bacterial strain and day. Minimum limit of detection was 1 CFU; Maximum limit of detection was 105 CFU. Data shown were collected in 1 (A-B) or 2 (C-D) independent trials; n = 40 fleas per strain per day. Data were analyzed by Chi-square test with Bonferonni post-test, comparing each mutant to KIM6+, with a significance level of P<0.025. "a" denotes significant comparisons on day 1; "b" denotes significant comparisons on day 7. Panels B and D: Analysis of only infected fleas from Panels A and D; fleas with 0 CFU not included. Bacterial load from each infected flea is displayed, and the bar in each lane indicates the population median. A Kruskal-Wallis non-parametric analysis with Dunn's post-test for multiple comparisons was performed, and significant pairwise comparisons are indicated: * P<0.05, ** P<0.01, *** P<0.001, **** P<0.0001.

