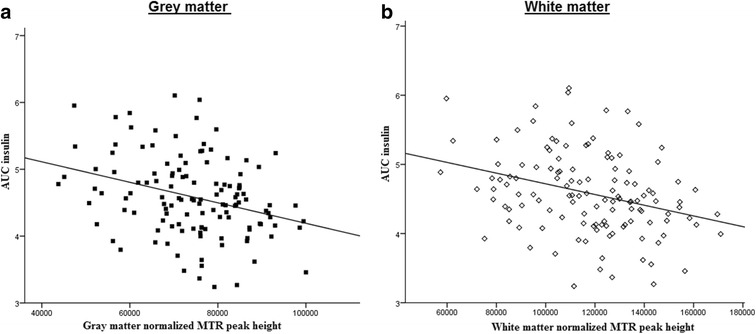
Fig. 2.

Relation between the area under the insulin curve and MTR peak height in gray and white matter. Scatterplots showing the inverse relation between area under the insulin curve (AUCinsulin) and a gray matter and b white matter MTR peak height. Lines of best fit were derived from bivariate Pearson’s correlations
