
Fig. 3.
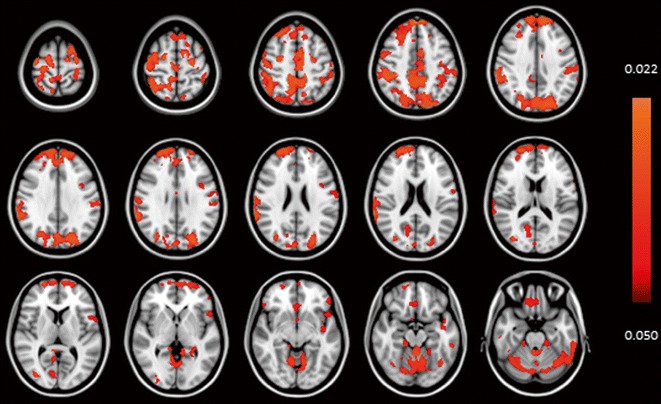
Voxel-based analysis of relation between cortical gray matter magnetization transfer ratio and insulin. Color scaling legend: color (red-orange) represents voxels that are statistically significant for lower gray matter MTR in association with higher AUC insulin (area under the insulin curve). Results are from voxel-based morphometric (VBM) analysis of cortical gray matter MTI magnetization transfer ratio (MTR). Results are projected on the MNI152 space T1-weighted image provided by FSL. Statistical analysis was adjusted for sex, age and offspring-partner status. Threshold-free cluster enhancement was applied with a significance level set at P < 0.05, corrected for family wise error rate