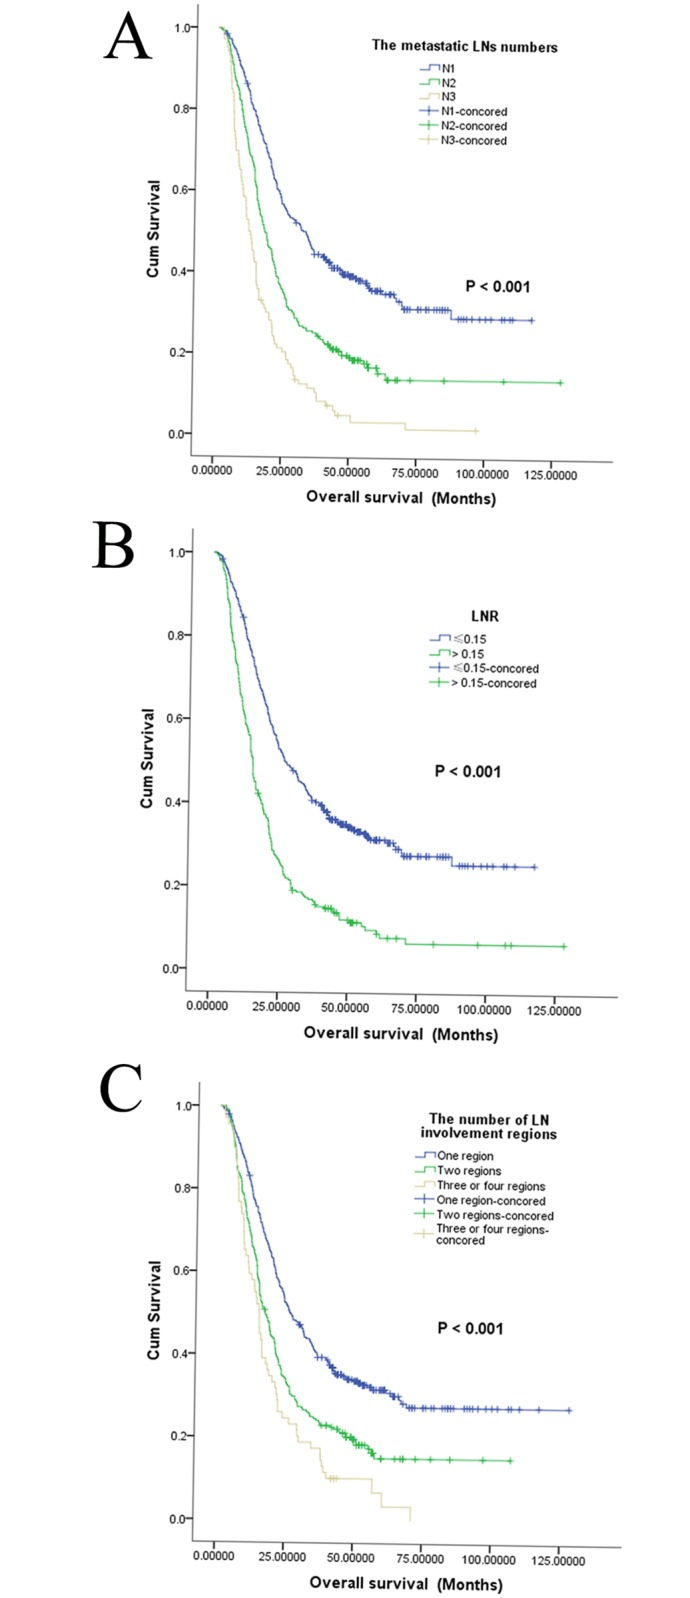
Fig 2. Kaplan-Meier overall survival curves for 668 patients.

The patients were stratified by the number of metastatic lymph nodes (A), the lymph node ratio (B), or the number of involved lymph node regions (C).

The patients were stratified by the number of metastatic lymph nodes (A), the lymph node ratio (B), or the number of involved lymph node regions (C).