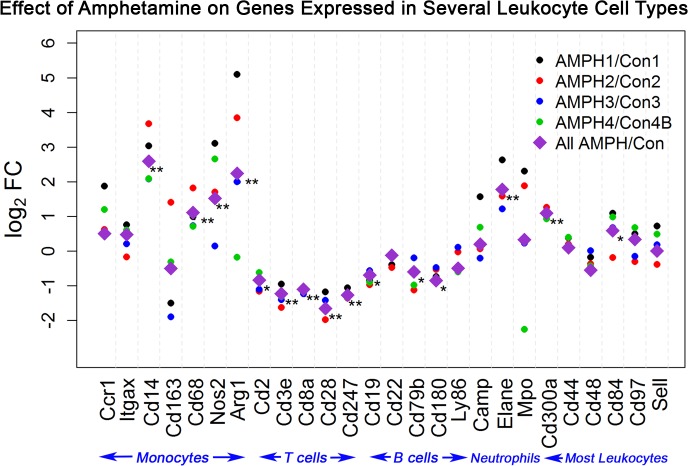
Fig 6. Expression Changes in Genes Primarily Expressed in Monocytes, B-cells or T-cells, and all Leukocytes as a Result of Neurotoxic AMPH Exposure.
Scatterplot of log2 fold change (AMPH to control) expression of the selected immune-related genes. For each gene, values of log2FC are presented for each time-matched subgroup comparison using a different colored dot for each subgroup (AMPH1/Con1, black; AMPH2/Con2, red; AMPH3/Con3, blue and AMPH4/Con4B green). The pooled expression of AMPH to control over all subgroups (AMPH/Con) is represented by a purple diamond. Differential expression was assessed for the latter comparison. Log2FC expression for genes with adjusted p-values smaller than 0.05 and 0.58 < |log2FC| < 1 is marked by one asterisk. Likewise, expression for genes with adjusted p-values smaller than 0.05 and |log2FC|≥ 1 is marked with two asterisks.

