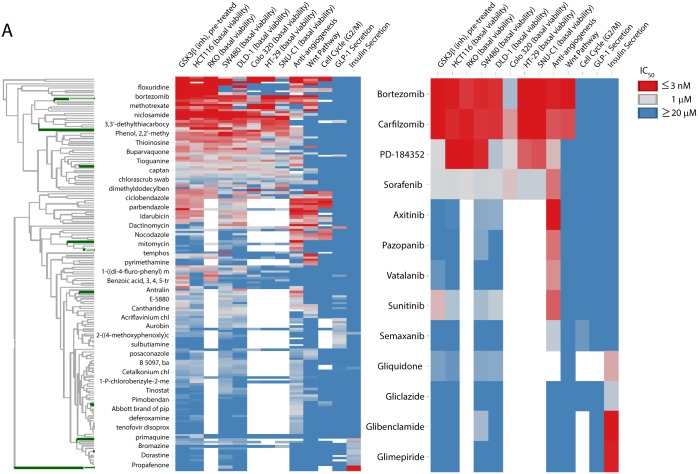
Fig 1. Heatmap representation of activity results for 173 active compounds vs. primary assays from 6 OIDD phenotypic assay modules.
The clustering was performed on log10-transformed IC50s from S2 Table. The color scale ranges from blue (IC50 ≥ 20 uM) to red (IC50 ≤ 3 nM). The positions of compounds shown in the inset are highlighted in green on the compound dendrogram.

