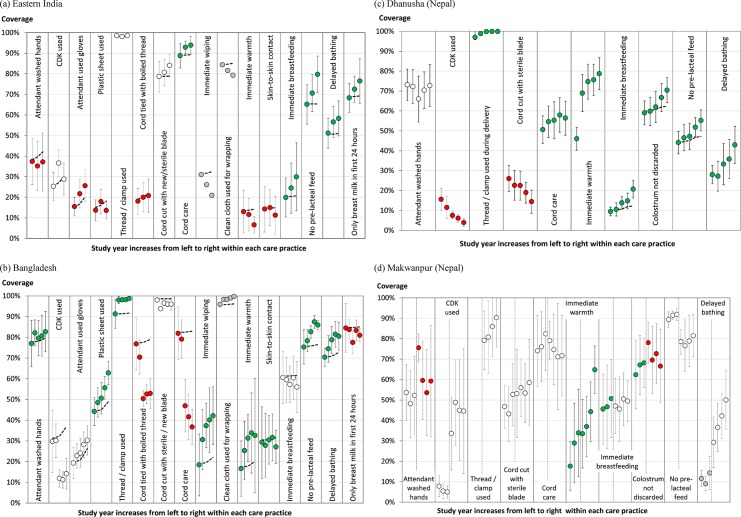
Fig 4. Trends in care practices.
The cluster-averaged coverage of each care practice in each study year for (a) Eastern India, (b) Bangladesh, (c) Dhanusha (Nepal), and (d) Makwanpur (Nepal), with 95% confidence intervals. Study year increases from left to right within each care practice. The two phases of the Makwanpur study are separated by dotted vertical lines within each care practice. The dashed lines show the expected trend resulting from the observed shift in birth attendance alone, assuming the care practice coverage for attended and unattended births remain unchanged from study year 1 (see section I). Green (red) circles denote care practices with a statistically significant increase (decrease) in adjusted coverage between the first and last study year as determined from logistic regression modelling (see section III). Note that a significant change in adjusted coverage can be in the opposite direction to the trend observed in the cluster-adjusted coverage. White circles denote care practices with no statistically significant difference in coverage between the first and last study year after adjustment for geographic strata and birth attendance, whilst grey circles denote care practices for which the logistic regression quadrature check showed that the fit was not reliable.

