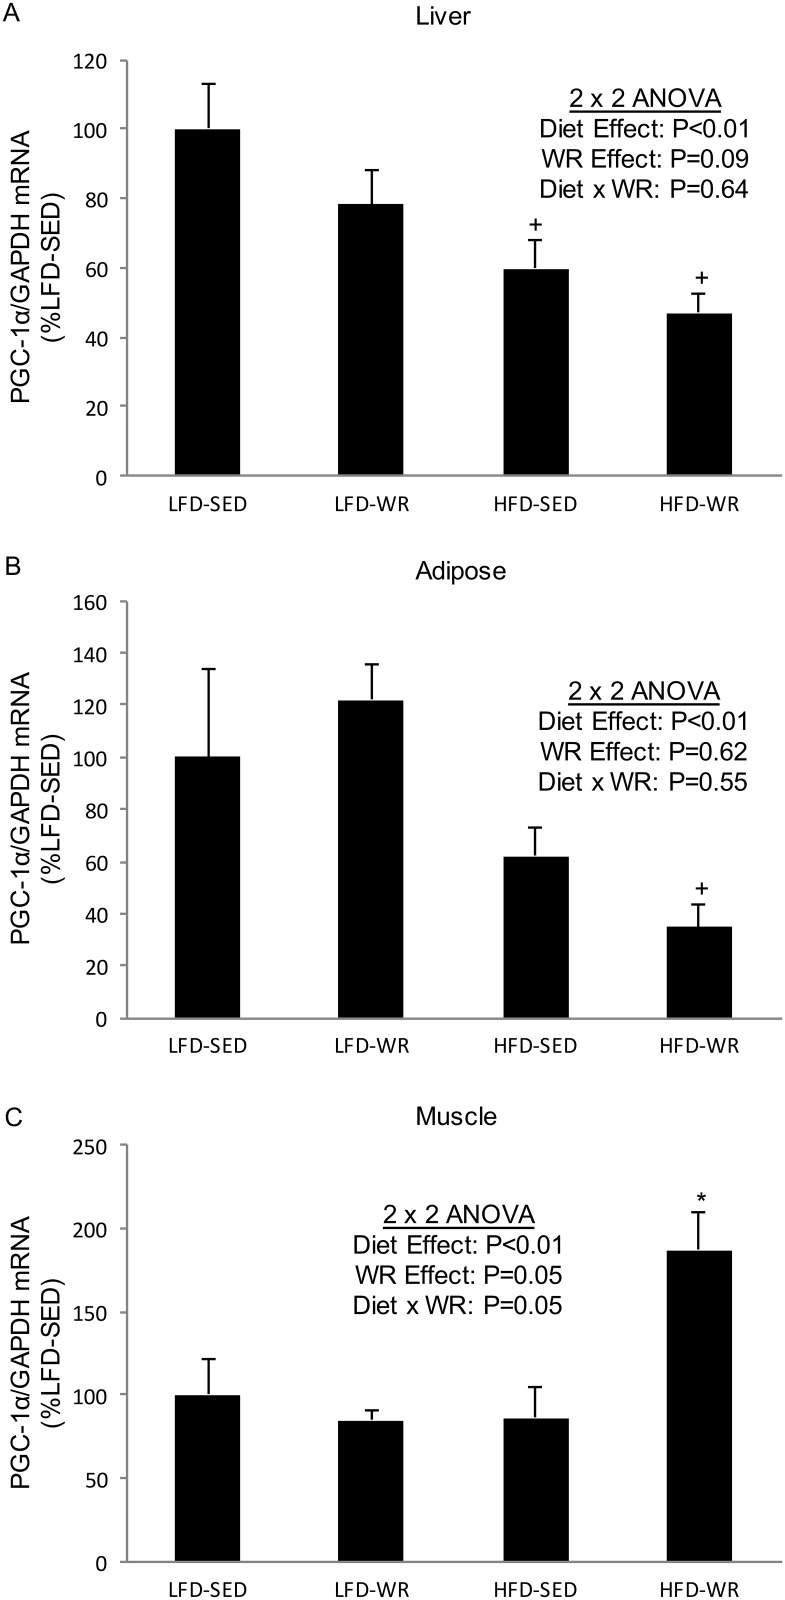
Fig 5. The effects of a high fat diet and voluntary wheel running on PGC-1α mRNA expression in liver, adipose tissue, skeletal muscle.
PGC-1α gene expression for liver (Panel A), epididymal adipose tissue (Panel B), and soleus muscle (Panel C) were normalized to GAPDH and expressed relative to LFD-SED values. *Denotes statistically significant difference from all other groups by Fisher’s LSD post-hoc test. +Denotes statistically significant difference from respective LFD groups by Fisher’s LSD post-hoc test. The number of mice per group is 4–5.

