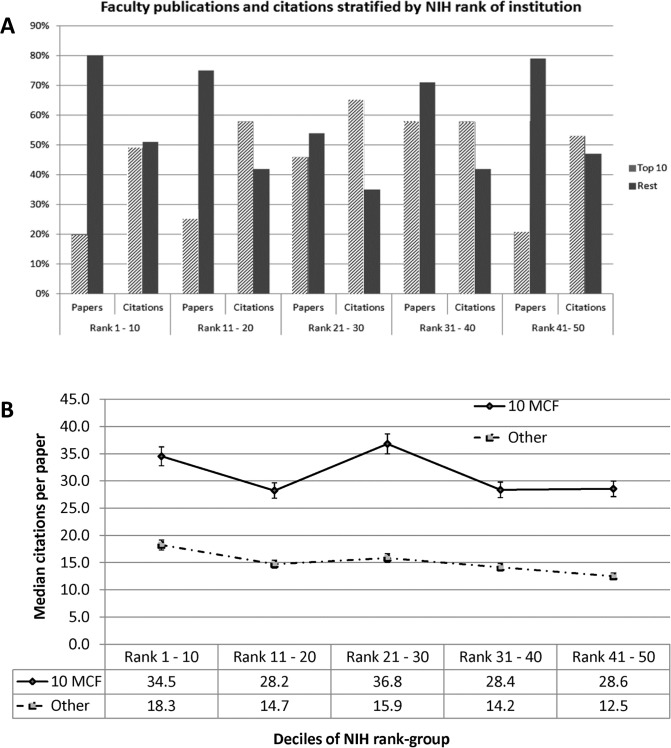
Fig 2. A Bar chart comparing between 10 most cited faculty and all other faculty, grouped by deciles of rank of the institution by NIH funding.
Indicated for rank-group are the percentages of all publications, citations towards which the faculty contributed. The top-10 faculty contribute between 20% and 46% of publications and 49% to 65% of all citations in a department. B Comparisons between 10 most cited faculty and all other faculty regarding mean numbers of citations per paper, grouped by rank of the department of surgery by NIH funding.

