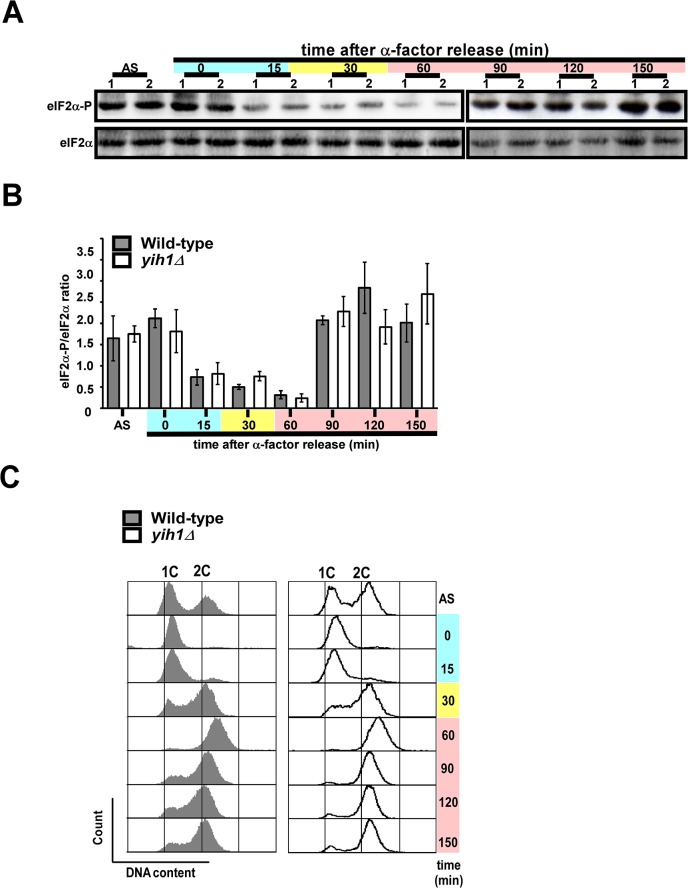
Fig 4. Phosphorylation of eIF2α along the cell cycle.
Exponentially growing wild type (MSY-WT2) and yih1Δ (MSY-Y2) cells were arrested in G1 with α-factor and released into fresh SD media. Samples were collected at the indicated time intervals. (A) WCEs of these cultures and of an asynchronous culture (AS) were subjected to immunoblot analysis, using antibodies against eIF2α phosphorylated on Ser-51 (eIF2α-P) and against total eIF2α. (B) Immunoblot signals from three independent blots as shown in (A) were quantified using the NIH Image J software, the ratios between eIF2α-P and eIF2α were determined and the results were normalized using the value of the ratio of the asynchronous cells (AS); values represent means ± S.E.. (C) Representative histograms. Flow cytometry analysis of DNA content of the samples used in (A). Blue, yellow and pink shaded boxes indicate the estimated G1, S and G2/M cell cycle stages, respectively.

