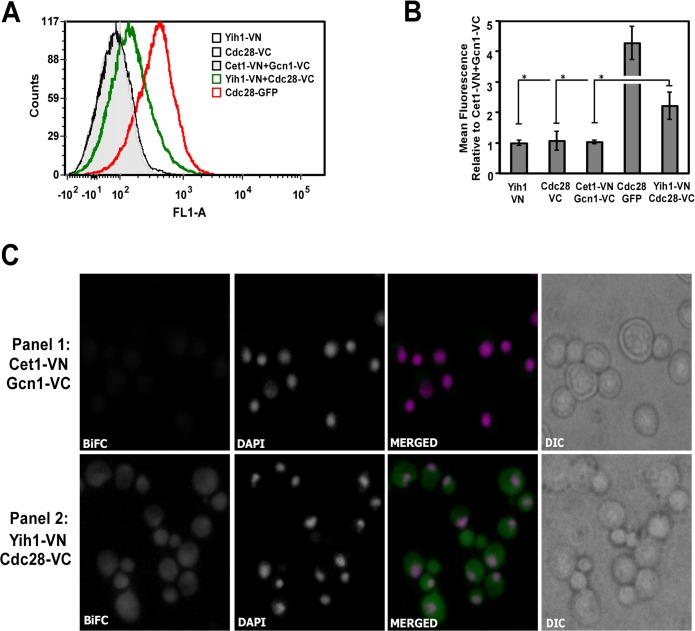
Fig 7. Endogenous Yih1 physically interacts with Cdc28.
Visualization of Yih1-Cdc28 interaction by BiFC analysis. (A) Representative flow cytometry histograms of live cells grown in SD medium to log phase. 2x10⁴ cells were analyzed per acquisition using the FL1-A channel. The strain co-expressing the protein Cet1 tagged with VN and the protein Gcn1 tagged with VC (Cet1-VN+Gcn1-VC) was used to define the basal fluorescence signal (gray filled histogram). The strain co-expressing Yih1-VN and Cdc28-VC (BCY20) showed increased signal intensity, indicative of a positive BiFC signal (green unfilled histogram). Strains expressing Yih1-VN (VN_3198) or Cdc28-VC (BCY21) alone were negative (black unfilled histograms). A strain expressing Cdc28 fused to GFP (YBL160W) was used as a positive control (red unfilled histogram). (B) The mean fluorescence intensities of each cell population analyzed in (A) were determined using the FlowJo software, version 9.3.3. The bar graph shows the mean fluorescence intensities of the analyzed strains relative to the values measured in the strain Cet1-VN+Gcn1-VC, which was set to 1. Data represent mean ±SE as error bars of three independent experiments performed in duplicate. * p < 0.05; (Student´s t test). (C) Representative fluorescence images of live cells grown as in (A). The strain co-expressing Cet1-VN+Gcn1-VC (RRY62a) is shown in panel 1. The strain co-expressing Yih1-VN and Cdc28-VC (BCY20) is shown in panel 2. In the merged images, nuclear DNA staining with DAPI is shown in magenta, the BiFC signal is shown in green, and the colocalization of DNA with the BiFC signal from Yih1-Cdc28 is shown in white, using the software Image J. DIC is also displayed. Images for strains expressing Yih1 (VN_3198) or Cdc28 (BCY21) alone are provided in S2 File.

